

Based on initial screening and shallow shotgun sequencing of 50 human DNA samples, five samples met the criteria for direct deeper shotgun sequencing (Methods), which resulted in genomes with ~ 0.20–1.11× average genomic coverage (mean ~ 0.61×). The number of detected SNPs from the 1240k panel28 varies between 189k and 741k (mean ~ 462k).
Initially, we used MyBaits Arbor Complete panel for genomic and mitogenome capture for other samples. However, following a critical review of this method29, we repeated the target enrichment with Twist capture in seven cases30 to validate the results. Overall, eight samples were processed with MyBaits Arbor capture, with an average of ~ 164k SNPs detected from the 1240k SNP set. For the Twist-captured samples, an average of ~ 182k SNPs was covered, ranging between 11k and 770k SNPs. Finally, we sequenced 14 mitochondrial genomes after a separate mitogenome capture for samples from the Gohar Tepe, Marsin Chal, Liarsangbon, Vestemin, and Kalmakareh archaeological sites (see Methods, Table 1, Supplementary Tables S1-S4). The mean mtDNA coverage was 44.57×.
We used the BREADR package (Biological Relatedness from Ancient DNA in R) to assess kinship among the whole-genome data samples and found no close relatedness with sufficient SNP overlap between the compared individuals32. The only exception is a pair of genetically identical/twin individuals (IRN23 and IRN25) from Liarsangbon (Supplementary Table S8). Anthropological records confirm that these two individuals are twins (Supplementary Information, Chap. 8).
Analysing possible parental relatedness in the new genome-wide dataset from Iran, we detected varying runs of homozygosity (ROH)33 signals among individuals from different archaeological sites (Supplementary Table S15, Figure S1). Individual IRN22 from Liarsangbon stands out with the highest ROH, characterized by long homozygous runs (> 20 cM) indicating a high degree of inbreeding, likely due to parents who were first- or second-degree relatives33. In contrast, individuals IRN24 from Gol Afshan Tepe, IRN57 from Mersin Chal, IRN23 from Liarsangbon and IRN02 from Vestemin show minimal ROH, whereas others have nearly no signal, suggesting a more outbred ancestry and a relatively large mating pool (Supplementary Figure S1). Comparing the current dataset with previous analyses of this kind, we infer that signals of consanguinity are sporadically present across the broader Early Neolithic Iranian Plateau (Ganj Dareh, Tepe Abdul Hosein, Wezmeh) and in the Turkmenistan areas, which had cultural contact with Iranian Plateau, including Chalcolithic sites such as Namazga and Parkhai21,34 (Supplementary Table S15). Evidence of small effective population sizes are also apparent at the Chalcolithic to Iron Age sites Tepe Hissar, Shah Tepe, Dinkha Tepe, and Hasanlu of the Iranian Plateau, as well as BA Turkmenistan. Considering the available Iranian and Turkmenistan prehistoric datasets, we conclude that the effective population size increased over time from the Neolithic to the Iron Age, where the Neolithic mating pool was 3–6 times smaller than in later periods (Supplementary Table S15).
A diachronic overview and frequency-based comparisons of the maternal lineages in the Iranian Plateau
To our knowledge, 127 ancient mitogenomes have been previously published from 20 archaeological sites on the Iranian Plateau, spanning the Mesolithic to Medieval times (Supplementary Table S5). We merged our new mtDNA results obtained from three different laboratory approaches (n = 23), with these mtDNA data. The combined dataset allowed us to identify 23 distinct maternal macro-haplogroups in the region (Fig. 2A).
A significant proportion of these ancient haplogroups correspond to the more ubiquitous West Eurasian lineages (70% in total), such as U, R, J, H, HV, and T, which are common even in the modern Iranian maternal gene pool35. In general, we detect a predominance of these maternal lineages on the Iranian Plateau during both prehistorical and historical periods. While the Neolithic-Chalcolithic periods show continuity to the BA on the maternal level, the latter period exhibits increasing variability with the appearance of several new mtDNA haplogroups. This trend is evident in the Shahr-i Sokhta dataset, which includes haplogroups such as L and M, R5 or T112, as well as the arrival of additional Eastern Eurasian lineages (A, B, C, D, F, R, U6, Y and Z) in the post-BA times. Our findings align with earlier archaeological descriptions of increased population mobility6,9. The Northwestern Iranian IA sample set9,12,13,17 is dominated by Western Eurasian haplogroups, however the IA also marks the introduction of Eastern Asian haplogroup D to the Iranian Plateau (Sagzabad site in the northern Qazvin province)11,17. These patterns are consistent with the mtDNA gene pool of southern Turkmenistan during the Chalcolithic – Bronze Age (except haplogroup L), which was connected geographically and culturally to the eastern Iranian Plateau. The historical sample set shows the abundance of J1, along with an absence of R and Eastern Eurasian mitochondrial haplogroups.
We conducted principal component analysis (PCA) on the maternal haplogroup frequencies derived from a dataset of the first hypervariable region of the mtDNA (Supplementary Table S5-6, Fig. 2B). Our data comprises samples from 19 modern Iranian groups (n = 1,498)35, and some representative ancient populations from different periods of Iran, such as EN Ganj Dareh, Chalcolithic Tepe Hissar, BA Shahr-i Sokhta, IA Hasanlu, and the newly-analysed historical samples from the Marsin Chal, Liarsangbon, and Vestemin sites in northern Iran.
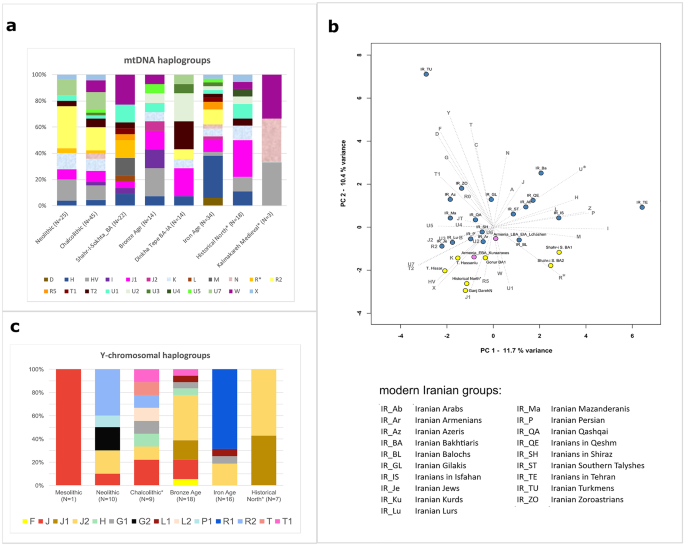
Summary of the uniparental data. (A) Distribution of the ancient Iranian mtDNA haplogroups; asterisks denote the samples analysed in this study. (B) PCA plot based on mtDNA haplogroup frequencies in modern Iranian and selected ancient Iranian groups. Using the frequencies of 36 haplogroups in modern and ancient Iranian populations, the first two principal components (PCs) capture 22.1% of the total variance (see Supplementary Table S6 for details). To maintain consistency and prevent sampling bias, we selected only those ancient groups that had more than 10 individuals or could be merged geographically and temporally, such as our historical samples. (C) Distribution of the ancient Iranian Y-chromosomal haplogroups (details in Supplementary Table S7).
Our mtDNA analyses reveal a distinct demarcation along PC1 between BA Shahr-i Sokhta samples, and other Iranian and Armenian ancient populations (Fig. 2B). The new historical samples cluster together with EN Ganj Dareh, whereas Chalcolithic Tepe Hissar and IA Hasanlu are also positioned closely on the mtDNA PCA. Notably, some modern Iranian groups align with our historical samples along PC2, particularly the Iranian Armenians and Lurs, who share similar frequencies of haplogroups H and HV, and elevated proportions of K and J1 (Supplementary Figure S10.1). The new Medieval sample set from Kalmakareh demonstrates the local continuity of N and HV lineages in Lurestan Province through to the modern era35, where Iranian Bakhtiari nomadic people (with 51% N and 15% HV frequencies) have been recorded to inhabit for the last 800 years36. Trends in the mitochondrial gene pool are described in detail in Supplementary Information, Chap. 10 (Supplementary Table S5-6).
Y-chromosomal haplogroup distribution
To achieve an overview of the paternal genomic composition of the region, we combined the new Y-chromosomal results (n = 7) with data from previously published Mesolithic to historical-period males (n = 61), originating from 13 different archaeological sites in Iran (Supplementary Table S7 and Fig. 2C). The Y-chromosomal variation among the ancient Iranian populations mainly consisted of haplogroups J, G, L, R and T. The presence of the South Asian macro-haplogroup H, detected in Late Chalcolithic (Tepe Hissar) and Bronze Age (Shahr-i Sokhta) sites, aligns with the previously described cross-regional interactions characteristic of the Indo-Iranian borderland area12,13 (see more detail in Supplementary Information, Chap. 10). Haplogroups G, J, P1 and R2 were present on the Persian Plateau and its surroundings as early as the Mesolithic and Neolithic periods5,7,12,13. Our findings align with the previous research, indicating that these lineages have been present in the region for millennia. Haplogroup J1 is widely recognized to have originated approximately 20,000 years ago in a region encompassing western parts of the Persian Plateau13,37. In Iran, J1 can be traced back to the Bronze Age at the Hasanlu and Dinkha Tepe sites in the northwest13 (Supplementary Table S7). The evidence of its presence in the Plateau now extends into historical times with the newly analysed samples. Haplogroup J2 is considered to have formed approximately 31,600 years ago in a region covering northwestern and western Persian Plateau38. The frequency of J2 seems to have increased from the Neolithic era and it reached its peak during the Bronze Age, and remained at a relative high frequency into the historical periods in the Iranian Plateau, potentially due to greater interactions with regions to the west of the Plateu7,12,13 (Supplementary Table S7, Fig. 2). More details on the newly analysed dataset can be found in Supplementary Information, Chap. 10.
Population genomic trends from the Neolithic to historic periods in the Iranian Plateau
In order to compare the new Iranian sample set to the published ancient and modern Eurasian populations, we applied genomic PCA on ancient and modern Eurasian and North African samples from the AADR Human Origins (HO) dataset v5439, supplemented with other relevant published datasets (Supplementary Table S9). f4-statistics and qpAdm40,41 were performed on subsets of the AADR 1240k and HO dataset and other published ancient individuals (see Methods). We performed supervised ADMIXTURE42 on a subset of this merged dataset (n = 3913), as described in Methods, with results presented in Fig. 3, Supplementary Figure S11.3 and Supplementary Table S10.
Based on the observations by Davidson et al.29 regarding allelic bias of the Daicel Arbor Prime Plus capture data, we treated different capture data from the same individuals and groups separately, and used them to cross-check the allele sharing analyses. Since the Iranian and South-Central Asian reference samples consisted entirely 1240k or shotgun data, potential artificial affinities between Arbor Prime reference and target data were not expected. Considering the PCA, ADMIXTURE, and D and f3-f4 statistics conducted with our dataset, we conclude that Arbor and Twist captures did not introduce major discrepancies that could affect the interpretation of the results (Figs. 3 and 4, Supplementary Figures S11.4–9, Supplementary Tables S11-12). However, differences were observed in the qpAdm models for these samples (Supplementary Tables S13-14).
On the genomic PCA, we projected ancient samples onto a subset of the modern Eurasian dataset. We observe notable differences among ancient and modern groups inhabiting the areas within and surrounding the ancient Eurasian Silk Road, which also crossed the Iranian Plateau towards the Mediterranean43. Based on principal component 1 (PC1), we identify two distinct clines relevant to our study: (1) the Southern Steppe cline, stretching between Caucasus/Iran and the Central Asian populations19, and (2) the Indus the Periphery Cline, extending between Western Asia and Southern Asia12. Ancient and recent populations of the Iranian Plateau are clustered in the centre and bottom-centre of the PCA plot, along with South Caucasian groups (Fig. 3, Supplementary Figure S11.2).

Eurasian PCA and supervised ADMIXTURE focusing on the genetic variation of Western Asia and its adjacent territories. (A) Grey dots represent modern reference populations, with some labelled in blue. Three-letter codes and detailed information on the ancient and modern populations used in the PCA plot are provided in Supplementary Table S9. A detailed view of the PCA is available in Supplementary Figure S11.2. (B) Supervised ADMIXTURE analyses of the most relevant samples and groups with Iranian EN Ganj Dareh, Anatolian Neolithic (ANF), Onge (AHG), WSHG and Botai (ANE-related), Shamanka Eneolithic (ANA), China LN, and Iron Gates HG (Balkan HG) as fixed sources. For more details and references, see Supplementary Table S10. Individual values and standard errors per component were used for the group-based representation, as described in Methods. Results of the full ADMIXTURE run are presented in Supplementary Figure S11.3.
In the following section, we provide a comprehensive overview of the Iranian prehistoric and historic datasets, highlighting major genetic trends observed through various population genetic methods. The first two principal components position the Iranian Mesolithic and EN samples as distinct from all other ancient and modern samples, indicating their unique base composition, even distinct from CHG, which has been previously discussed as cladal to EN Iran13. Previous studies have described EN groups (Tepe Abdul Hosein and Wezmeh) as homogenous with each other, using either CHG13 or EN Ganj Dareh as unadmixed sources for their modeling12. We consider both EN Ganj Dareh and CHG as suitable local sources for the subsequent populations of the Iranian Plateau. In supervised ADMIXTURE, we observe that CHG harbours the pre-defined Ganj Dareh-related and ANE-related components, aligning with Allentoft et al.15. We note, therefore, that some of the ANE-related component appearing in the Persian Plateau in our analyses may stem from CHG-related ancestry. In subsequent analyses, we tested the potential differences between EN Ganj Dareh and CHG, as well as the impacts of CHG-related components on the Plateau. We conclude that their contributions vary geographically but cannot be separately quantified within the current dataset (f4, qpAdm).
In the same supervised ADMIXTURE analysis, we observe that the ancestry composition of the Natufian and pre-pottery Neolithic individuals from the Levant is represented by 20–25% EN Ganj Dareh and 66–78% ANF ancestries (Supplementary Figure S11.3). This suggests that some Levantine ancestry present on the Persian Plateau might be masked within these components. We took these limitations in consideration during the subsequent analyses.
Genetic structure of the Iranian plateau during the Neolithic-Chalcolithic transition
We studied a new Early Chalcolithic male genome from the 5 th millennium BCE Gol Afshan Tepe site, located on the eastern foothills of the Zagros44, which predates all other published Chalcolithic genomes from Iran5,12. Supervised ADMIXTURE indicates that he was a descendant of Early Neolithic farmers related to the populations of Ganj Dareh, Wezmeh and Tepe Abdul Hossein, all located in the central Zagros area (Fig. 1). On the PCA, the Gol Afshan individual shifts toward more-western ancestry profiles. In f4-statistics, he still shares more genetic drift with EN Ganj Dareh than with CHG, LN Hajji Firuz, Chalcolithic Tepe Hissar or Chalcolithic Seh Gabi (Fig. 4B, S11.5), indicating the EN Iranian component as a more likely source than CHG in this region. Among Neolithic Iranians, the pairwise allele sharing of the Gol Afshan individual with EN Ganj Dareh and Neolithic Tepe Abdul Hosein is not significantly different. Nevertheless, Gol Afshan shares the most alleles with Ganj Dareh and Tepe Abdul Hosein among any other Neolithic and Chalcolithic groups of the Iranian Plateau (Supplementary Figures S11.5). In line with the genetic results, substantial cultural continuity has been detected during the Neolithic-Chalcolithic cultural transition. The Bakun-period Gol Afshan Tepe site was used semi-sedentarily (Supplementary Information, Chap. 1). A ritual ceremony, recorded in the burial type, and the common practice of artificial cranial deformation, also observed at the Gol Afshan Tepe individual, find parallels at the EN Ali Kosh archaeological site in the central Zagros45. Moreover, contemporaneous with Gol Afshan Tepe, numerous instances of artificial cranial deformation and other cultural similarities have been recorded at the Chega Sofla archaeological site in the southern Zagros44,46 (Supplementary Information, Chap. 1). All these findings suggest long-term cultural and biological continuity in and around the Zagros region.
In supervised ADMIXTURE, we observe approximately 8–10% additional AHG component in the Gol Afshan and Tepe Abdul Hosein groups. This minor Neolithic variation, also identified using Tepe Abdul Hosein in the f4-statistics and shown in Fig. 4B-C, suggests the presence of further ancestral pre-Neolithic or Neolithic genetic elements that warrant exploration in future studies. Statistics such as D tests in the form of D(Gol Afshan, Tepe Abdul Hosein, Shahr-i Sokhta BA1/2, Mbuti), comparing between the allele sharing patterns of the two Shahr-i Sokhta genetic groups, suggest that this variation is not a gene flow from the Indo-Iranian borderland, but reflects unascertained genetic diversity within the prehistoric Iranian Plateau. This diversity appears to distinguish most of the eastern regional variation from the northwestern Plateau and the South Caucasus (Supplementary Table S11, Figs. 3 and 4B-C). In subsequent analyses, we demonstrate that several two-way and three-way distal qpAdm models fitting Gol Afshan require AHG as a proxy source. However, Gol Afshan can also be modelled without the AHG-related component (Supplementary Table S13).
Besides the dominance of local EN continuity, the eastward expansion of Levant/ANF-related components is also observable in the mid-5 th millennium BCE Gol Afshan individual44, in addition to previous evidence from northwestern Iranian Late Neolithic-Chalcolithic12,13. This individual exhibits a significant excess of allele sharing with ANF when compared to the Neolithic Iranian genomes from the same Zagros region (see D-statistics in Supplementary Table S11, Z = 4.182). A series of qpAdm tests indicate additional ancestries to the EN Ganj Dareh component in Gol Afshan, such as ANF (modelled with a 17% contributions), or Neolithic Armenia (Masis Blur and Aknashen), LN Hajji Firuz and Chalcolithic Israel, all of which also show significant ANF ancestries12,13. Overall, these show the early admixture events of western influxes into the Neolithic Iranian gene pool. We capture with f4-statistics that every reference group from the Iranian Plateau shares more allele with ANF than with the Natufian and pre-pottery Neolithic Levant (Supplementary Figure S11.9, Supplementary Table S11). We also find that Iraq PPNA exhibits higher allele sharing with ANF than with pre-Chalcolithic Levant or EN Ganj Dareh (Supplementary Figure S11.9). Meanwhile, for the ancient groups of the Iranian Plateau and its surroundings, we demonstrate a correlational increase in allele sharing with the ANF-related ancestries (Turkey_N) and Levant-related ancestries (Jordan_PPNB) (Fig. 4D). These findings indicate the influx of a profile combining both ancestries. This evidence aligns with the commercial interactions of Zagros inhabitants like Ganj Dareh, HajjiFiruz, and Bakun excavation areas with Levantine communities in Syria. These interactions are evidenced by the use of numerical tokens dating back to the Neolithic–Chalcolithic time horizon47. We acknowledge (based on Lazaridis et al.13 and our plausible qpAdm models) that the amount and direction of potential Levantine influx might be characterized better in future research, if additional high coverage comparative data become available.
The correlated allele sharing of the ancient Iranian and surrounding groups shows regional patterns, regardless of temporal differences, with the sharing with ANF and Levant components increasing from east to west (Fig. 4D). Together with the supervised ADMIXTURE analyses, this demonstrates a long-standing East-West genetic cline of the Neolithic Iranian and ANF ancestries13. For instance, this is observable in the northern area through two Chalcolithic sites located more than 700 km apart and from different time periods. The Tepe Hissar group (ca. 3600 − 2000 BCE) exhibits lower ANF-related ancestry (~ 7%) and higher EN Ganj Dareh component compared to a Chalcolithic western Iranian group, such as Seh Gabi (ca. 4800 − 3700 BCE), which carries ~ 27% ANF-related ancestry, as shown in supervised ADMIXTURE and f4-statistics (Fig. 4A). This increase is also observed in the northwest Iranian sites from the LN-BA periods, such as Hajji Firuz, Hasanlu, and Dinkha Tepe, which harbour even higher levels of ANF-related ancestry than Tepe Hissar and Seh Gabi (Fig. 3A-B).
Genetic relations of Chalcolithic and Bronze Age groups of the Persian Plateau
The Mesolithic-EN ancestry forms a predominant basis in the Chalcolithic-Bronze Age genomes from the Iranian Plateau and South-Central Asia. The eastern Iranian BA Shahr-i Sokhta group 1 exhibits a high proportion of EN Ganj Dareh ancestry in its representatives (up to 65% in ADMIXTURE and shown by f4) and an absence of ANF ancestry. The predominant EN Ganj Dareh related ancestry (~ 70% in ADMIXTURE) in the earliest Chalcolithic samples from the Turkmenistan area (Parkhai, Namazga and Geoksyur, dated to ca. 3400 − 2800 BCE) suggests intense connections with the Iranian Plateau. The ANE-related ancestry observed through ADMIXTURE in these genomes aligns with the detection of these components in South-Central Asia by Narasimhan et al.12 and with our f4 statistics (Fig. 4C). Archaeological evidence indicates interactions within the Persian Plateau as early as the EN, through the yet genetically unsampled Jeitun culture’s population, which occupied the territory of modern Turkmenistan48. Published Chalcolithic and BA groups of Turkmenistan (represented here by Geoksyur and Gonur sites) and Uzbekistan (Sapalli Tepe and Bustan sites) exhibit strong genetic similarities with the Chalcolithic Tepe Hissar, BA Shah Tepe, and BA Shahr-i Sokhta group 1 from Iran12,14. The Sapalli culture from Uzbekistan, which thrived from the first half of the 3rd to the mid-2nd millennium BCE, was closely related in material culture to BA Turkmenistan (Namazga, time periods V and VI) and Iran (Shahr-i Sokhta and Hissar III)21, reflecting the observed genetic homogeneity in the region. Meanwhile, ceramic traditions at Shah Tepe and Tepe Hissar demonstrate continuity from the Chalcolithic to BA periods34. Numerous specific artefacts —including soapstone beads, semi-precious stones, and various tools such as local blades, saws, and polished grey pottery—have been discovered at both Shahr-i Sokhta and Tepe Hissar sites, located in the northeastern and eastern Iranian Plateau. Subsequently, these artefacts were widely distributed across sites throughout the eastern and western Persian Plateau, suggesting that these two sites functioned as industrial centres facilitating cross-regional interactions49,50,51. Notably, Shahr-i Sokhta also exhibited increased population diversity, possibly coinciding or correlating with its role (Fig. 3B, see Supplementary Information, Chap. 10).
Stability in the historical periods of the Northern Iranian Plateau
The CHG and EN Iranian ancestries became intermixed by the end of the prehistoric periods, consistent with observations across different periods13,14,52,53,54,55,56. These ancestries persist at levels of around 45–51% in the IA groups of the northwest Iranian Plateau (Hajji Firuz, Hasanlu, Dinkha Tepe sites) in our supervised ADMIXTURE analyses. Furthermore, they remain consistently predominant in the northern Iranian Plateau during the historical period, including the Achaemenid to Sassanid era burial sites of Marsin Chal, Liarsangbon and Vestemin. Most of these individuals can be modelled with CHG as a single source in both individual and group-based qpAdm models (including the combined Iran Historical group). However, the Liarsangbon individuals require an additional western component (16–26% ANF, Neolithic Armenia or Chalcolithic Israel). This finding is further supported by significantly negative f4 results in the form of f4(MersinChal.SG, Liarsangbon.SG, ANF, Mbuti.DG) and aligns resembles the Liarsangbon site’s closer location to the western Iranian Plateau (Supplementary Table S11). Additionally, it also coincides with the cultural differences of Liarsangbon, evidenced by the discovery of non-local artefacts of Egyptian origin from the Roman times (Figs. 3 and 4)57.
Evaluating other possible source populations, we demonstrate through f4-statistics in the form of f4(CHG, Test, Samara_EBA_Yamnaya, Mbuti.DG) and qpAdm models, that the BA Steppe affinities is only apparent due to shared CHG-related ancestries, which were previously defined in the BA Steppe communities52 (represented in our dataset with Samara_EBA_Yamnaya, Supplementary tables S11,13). The AHG-type ancestry detected in ADMIXTURE persists into the historical period. Moreover, in some deep ancestry qpAdm models of the historical individuals, the AHG (Onge) component reaches detectable thresholds.
After assessing the distal ancestries of the historical-period individuals (Marsin Chal, Liarsangbon, Vestemin), we modelled their proximal ancestries using a more focused approach. On the PCA, ADMIXTURE, and f4 analyses (Figs. 3 and 4, Supplementary Figure S11.2–3, S11.6–8), these groups display ancestry patterns similar to those of the northeastern Iranian prehistoric samples, as well as to the BA Gonur and Sapalli Tepe from Turkmenistan and Uzbekistan. In accordance, the qpAdm models indicate a shared genetic ancestry of the historical period samples with the prehistoric northeast Iranians (Chalcolithic Tepe Hissar, BA Shah Tepe) or South-Central Asians (represented with Chalcolithic Geoksyur and BA Gonur group 1). Our analyses reveal that everyone out of the seven historical-period individuals yielding sufficient genome-wide data can be modelled either with one of these prehistoric groups as a single source or in a two-way model with an additional western Iranian source. In group-based analyses, shotgun genomes, such as those of the Marsin Chal and Liarsangbon groups (n = 2 in each) can also be modelled with the same sources. However, the proportions of the northwestern IA components with elevated ANF/Levant-related ancestries are more prominent in Liarsangbon (Supplementary Table S14). IA Hajji Firuz is the only additional western source that provides plausible models for all historical groups. Using this source, Marsin Chal can be modelled with ~ 78% BA Shah Tepe and additional ~ 22% IA Hajji Firuz, while for the Liarsangbon group these amounts are ~ 37% BA Shah Tepe and ~ 63% IA Hajji Firuz. The combined group, referred to as Iran_North_Historical, produces similar results and can be modelled with ~ 52% BA Shah Tepe and ~ 48% IA Hajji Firuz-type contributions (Supplementary Table S14). We interpret these findings as evidence that the genetic profiles of historical-period groups of the northern Iranian Plateau reflect their position along the broader east-west genetic cline, rather than resulting from specific admixture events.
Scattered evidence on medieval and modern Iranian populations
The Medieval period individual from the Kalmakareh Cave in western Iran has a genetic profile similar to those of the northwestern groups of the Iranian Plateau, such as Hasanlu and Hajji Firuz, as well as a Medieval sample from Ganj Dareh, as observed both on the PCA and in ADMIXTURE. This, combined with f4 and distal qpAdm results, indicates a reduction of Iran Neolithic ancestry in the western Iranian Plateau over time. Meanwhile, most of the genetic ancestry of the newly published individual can be modelled in qpAdm with the mentioned IA variety in the Plateau, such as IA Hajji Firuz as the single source or as a mixture of IA Hasanlu (~ 80%) and another source (e.g., ~ 20% Shah Tepe from the northeast). The lack of published ancient individuals from southwestern Iran limits further investigation into the regional genetic ancestries.
On the PCA, modern Iranians align with the majority of the Iranian prehistoric and historic genetic variation, but do not exhibit the Indus Periphery Cline characteristics previously described in the BA by Narasimhan et al.12. In addition to clustering together in the PCA, the Mazandarani and Fars groups of Iran also show similar population models, albeit in different proportions, in the qpAdm analyses performed on the Human Origin dataset (Supplementary Table S14). Further Medieval and modern genome-wide sample pools are required to better understand the formation of the modern Iranian genetic variation.
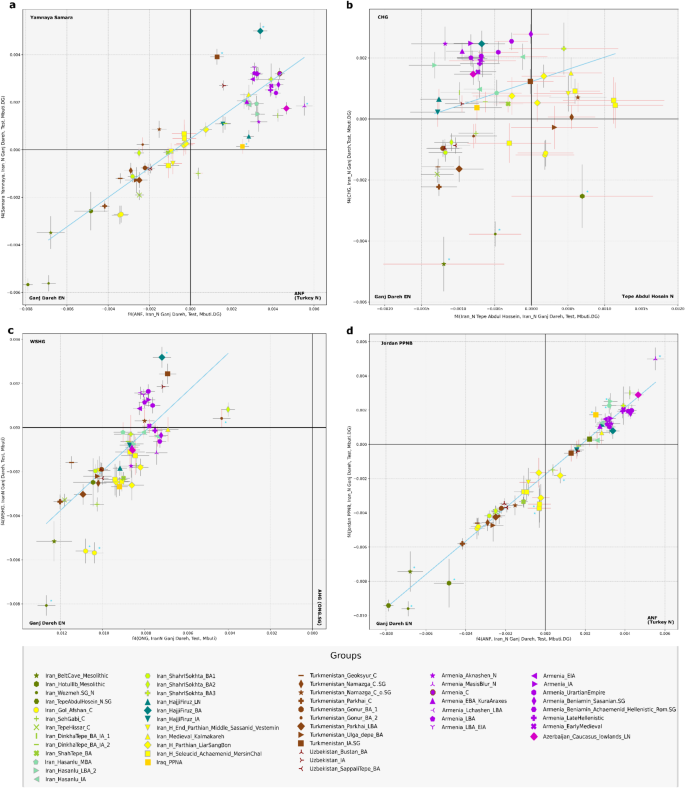
Two-dimensional scatterplots of seven f4-statistics. The four panels represent scatterplots of different f4 model combinations. f4 estimates and corresponding Z-scores are provided in Supplementary Table S11. Non-significant Z-scores are indicated with red error bars. Blue lines represent regression analyses (Weighted Least Squares (WLS) linear regression) and blue stars denote groups that deviate significantly from the regression, based on the model fit and the variability captured by the weighted standard deviation. Data produced using different laboratory methods from the same sample is indicated with a single symbol.