
![[OC] I read all 30 of Elin Hilderbrand’s novels and visualized the characters, themes, and crossovers between books.](https://www.byteseu.com/wp-content/uploads/2025/07/c305ntqceubf1-819x1024.png "[OC] I read all 30 of Elin Hilderbrand’s novels and visualized the characters, themes, and crossovers between books.")
I'm a data visualization designer and a lifelong beach read enthusiast—so this summer I dove into a passion project: reading every book Elin Hilderbrand has written (30 total!) and building a dashboard that explores her fictional world.
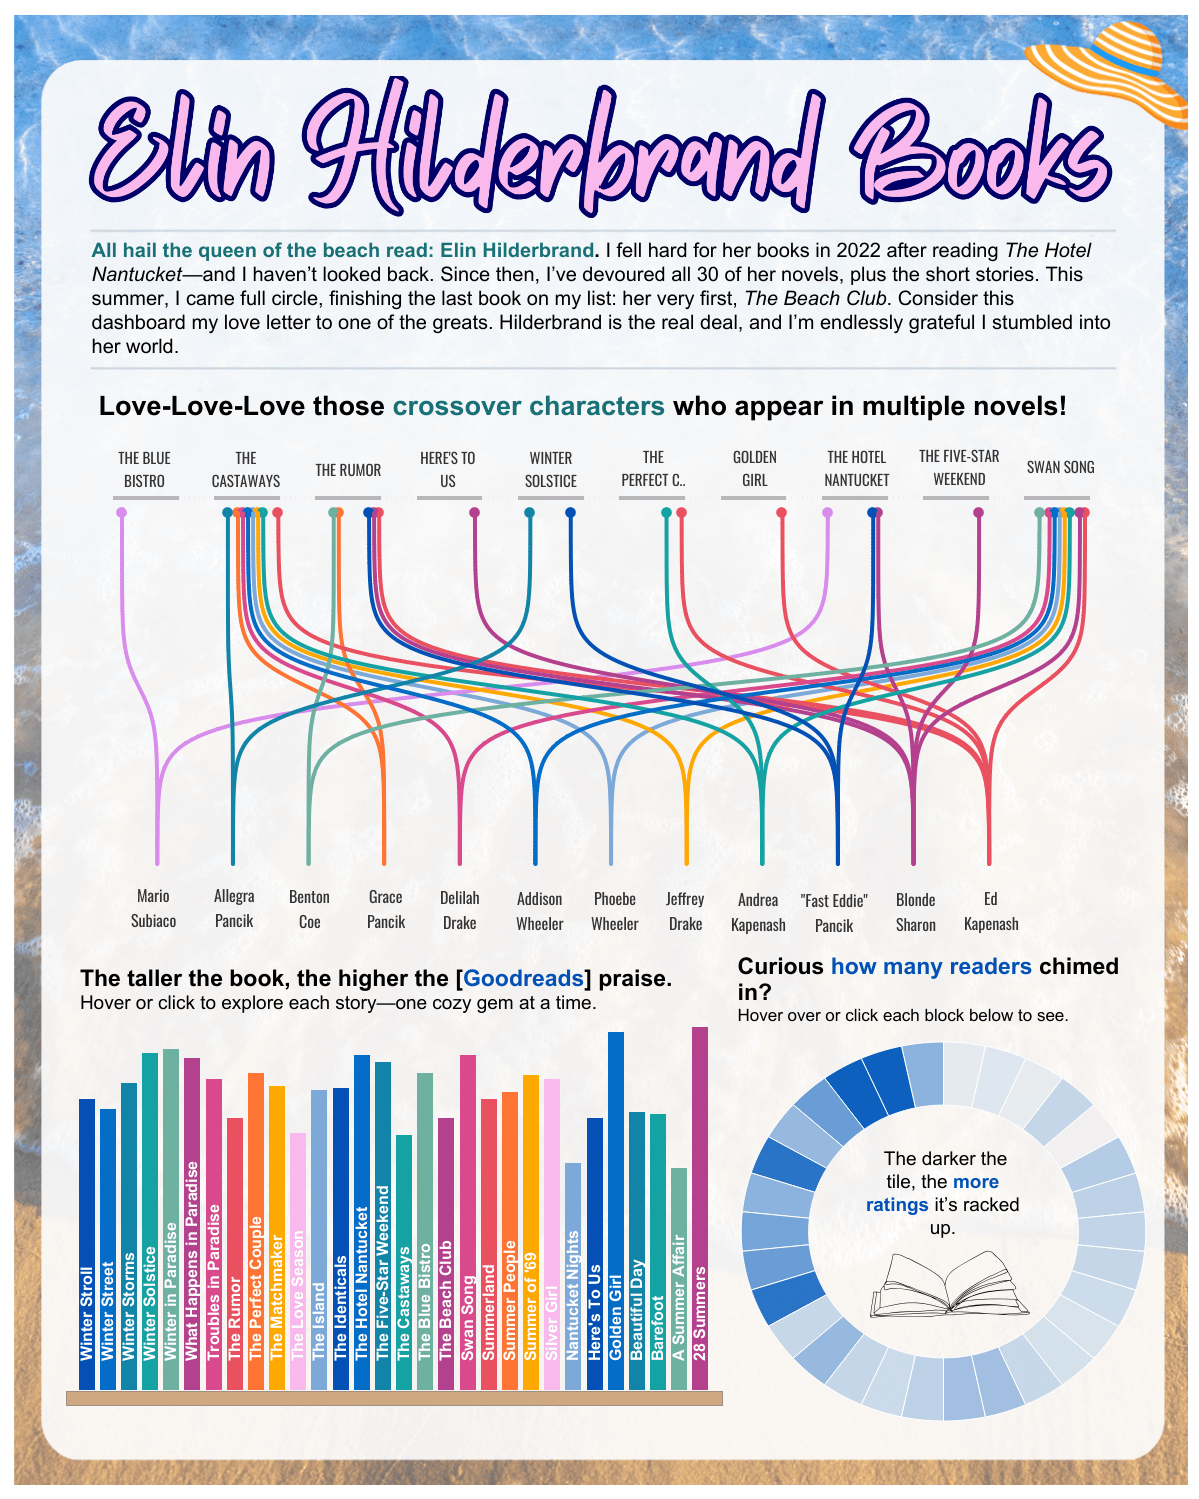
This Tableau viz includes:
- A Sankey chart showing how characters cross between books
- A heatmap of books by number of ratings
- Book-by-book comparisons by Goodreads rating
I designed it to feel both fun and deep—like an interactive companion to Hilderbrand’s work. Would love your thoughts!
▶️ Explore the full dashboard here
#Tableau #dataart
Posted by Solid_Somewhere_5427