
![[OC] My Journey watching the One Piece anime Visualized](https://www.byteseu.com/wp-content/uploads/2025/07/3tr8wxk47xdf1-1536x640.png "[OC] My Journey watching the One Piece anime Visualized")
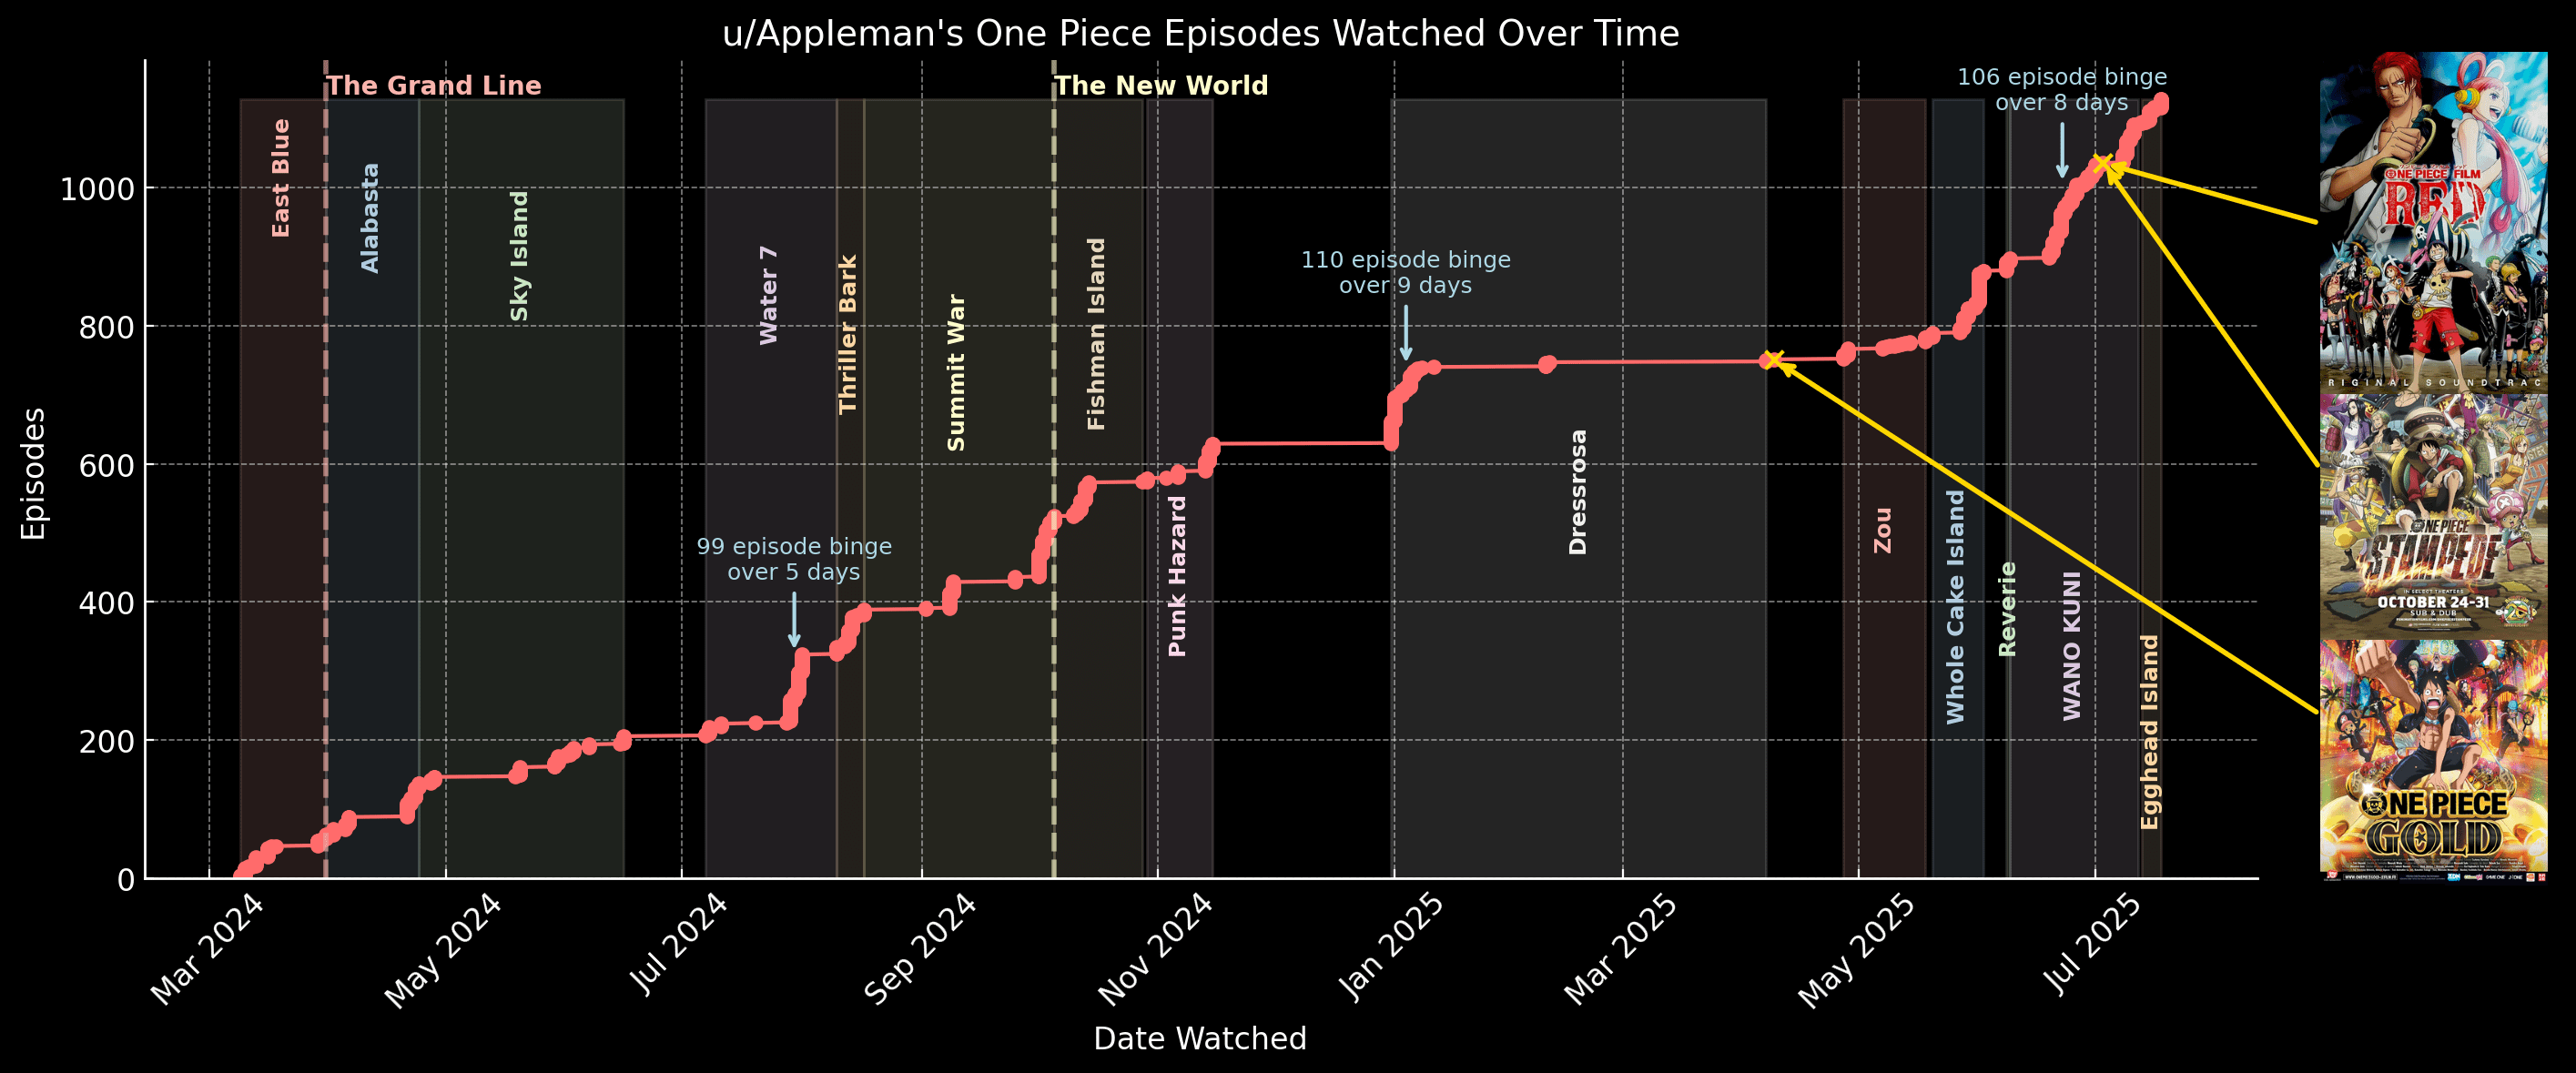
Last year, on March 9th, 2024, I decided to start watching the anime One Piece for the first time. Thanks to the Crunchyroll (streaming site) history, I was able to go back and document when I watched every episode and create this wonderful graph based on that data! Here are some fun overall data summaries to go with the graph:
🧭 Overall Stats
- Total Episodes Watched: 1136
- Total Calendar Days Spanned: 497 days
- Total Unique Watch Days: 238
- Average Episodes per Active Day: 4.71
- Most Active Day: Apr 07, 2024 — 22 episodes watched
- Most Active Month: April 2024 — 113 episodes watched
⏱️ Time Spent Watching (assuming each episode is 20 minutes, trimming off intro and outro)
- Estimated Time Watched: 374 hours (~15.6 full days)
- Average Time Watched per Calendar Day: ~45 minutes/day
- Total Percentage of Calendar Time Spent Watching: 3.14%
🥇 Top 3 Normalized Arc Binges
Based on: Episodes per day × log₁₀(total episodes)
- 🍰 Whole Cake Island — 96 episodes in 14 days → 6.86 eps/day
- 🏯 Wano Kuni — 196 episodes in 34 days → 5.76 eps/day
- 🧟 Thriller Bark — 59 episodes in 8 days → 7.38 eps/day
These scores reflect not just intensity but binge stamina across longer arcs!
🔥 Fun Facts
- I dedicated over two full weeks of my life (non-stop) to One Piece.
- My longest single-day binge hit 22 episodes — that’s 440 minutes of piracy.
- Across my active watch days, I averaged nearly 5 episodes per day!
Posted by AppIeman