
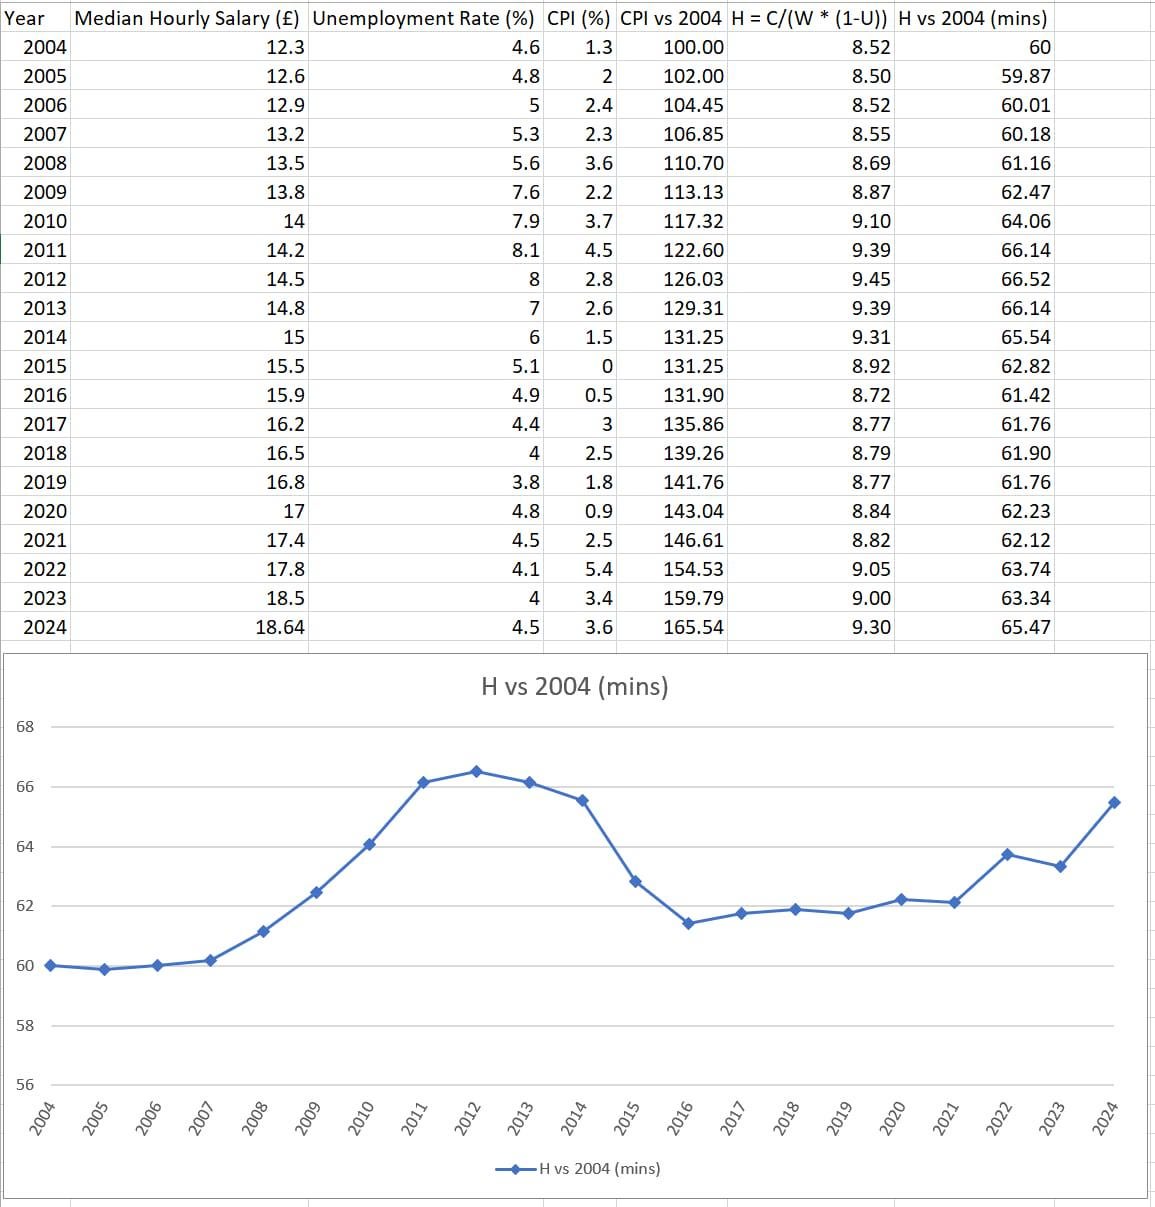
![[OC] The median person has to work 5 minutes longer per hour in the UK compared to 2004 to afford the same amount of CPI goods.](https://www.byteseu.com/wp-content/uploads/2025/08/5x3elxtywchf1-980x1024.jpeg "[OC] The median person has to work 5 minutes longer per hour in the UK compared to 2004 to afford the same amount of CPI goods.")
Higher values are bad!
The metric being calculated is the: Unemployment adjusted, real median hourly purchasing power. It is an attempt to answer the question "how hard is it for the average worker to get by". Median salary data does not consider unemployment, so I scale by the probability the average worker is unemployed. The final data is expressed as the number of minutes the average worker must work to afford the same products as a worker in 2004 can afford after 1 hour.
I start with an index of £100 of CPI goods and work out the hours needed to afford those (H). Then I rescale those so that 2004 is 60 -which can be interpreted as 60 minutes. If you rescale to 40 (i.e a 40 hour work week) you get a 43.6 hour work week in 2024.
This metric lags crisis events because reactions to crisis events are usually inflationary and inflation accumulates over time. This metric does not consider the value of retirement accounts which often react much quicker to crisis events. The assumption is that the median worker is using a their salary to pay for their lifestyle.
Does this line track your experience of how affordable it is to live better than GDP?
This metric is especially focused on what it "growth" means. In this model, it means working less and/or having more. With GDP it strictly means having more. GDP growth is not sustainable, it does not account for how automation (and AI) can impact unemployment more than the price of goods, or that working longer is not always a desirable way to increase productivity.
Posted by TheRealLargedwarf