

The differences between the concentrations in 2020 and 2019 were calculated for the individual provinces to address the spatial variability of concentrations. Tables 1, 2, 3, and 4 present the average differences between the years and quarters.
In the case of PM10 concentrations in 2020 compared to 2019, there was a reduction on average across the country—the smallest in the Świętokrzyskie Voivodship ( − 0.06 µg/m3) and the largest in the Podkarpackie Voivodship ( − 3.52 µg/m3). A concentration increase was shown only for Podlaskie Voivodship (5.45 µg/m3). The decreases in the first quarter are mainly due to important differences in February, which was anomalously warm, and no restrictions had yet been introduced in Poland. The most important decrease in concentrations in the first quarter occurred in the Silesian Voivodship ( − 13.52 µg/m3), as well as in the Opolskie and Podkarpackie Voivodship ( − 9.4 µg/m3 and -9.86 µg/m3), respectively. In the second quarter, the values of decreases are smaller and concern other voivodship—the largest reduction occurred in the Pomorskie ( − 7.11 µg/m3), Warmińsko-Mazurskie ( − 7.6 µg/m3) and Zachodniopomorskie ( − 6.47 µg/m3) Voivodship.
The third quarter was characterised by relatively small differences (except the Małopolskie Voivodship, where concentrations decreased by − 2.53 µg/m3). The fourth quarter was dominated by a downward trend in PM10 concentrations in 2020, resulting mainly from important decreases in October.
The observed changes in PM10 concentrations in 2020 compared to 2019 can be explained by a combination of environmental and socio-economic factors. Meteorological conditions were of particular importance—February 2020 was exceptionally warm (average temperature in many regions over 3°C higher than normal), which resulted in reduced consumption of solid fuels in the household sector. In addition, in the period from March to May, mobility restrictions related to the COVID-19 pandemic were introduced in Poland, which significantly reduced road traffic—a source of secondary dust emissions and primary emissions from transport. In some regions, the observed decrease could also have been supported by local low emission reduction programmes, e.g. under the “Clean Air Programme” It is also worth noting that in the winter of 2019/2020, there was no heavy snowfall or the need to intensively sprinkle roads with sand and salt, which reduced the phenomenon of dust resuspension from the road surface.
The spatial distribution of the differences between the annual average PM10 concentrations in 2020 and 2019 for individual stations shows that over the majority of the country, there was a reduction in the range of 2–3 µg/m3 on average (Fig. 2). An increase in concentrations compared to the previous year occurred at several stations in the Podlaskie, Lubelskie, Mazowieckie, Świętokrzyskie and Małopolskie Voivodship. It should be noted that in Podlaskie Voivodship, the analyses are based on measurements from only one station. This explains the different characteristics of the interannual variability of concentrations in Podlaskie Voivodship, as described earlier. The differences in concentrations in the second quarter of 2020 relative to 2019 are slightly more important in absolute value than the annual average change.
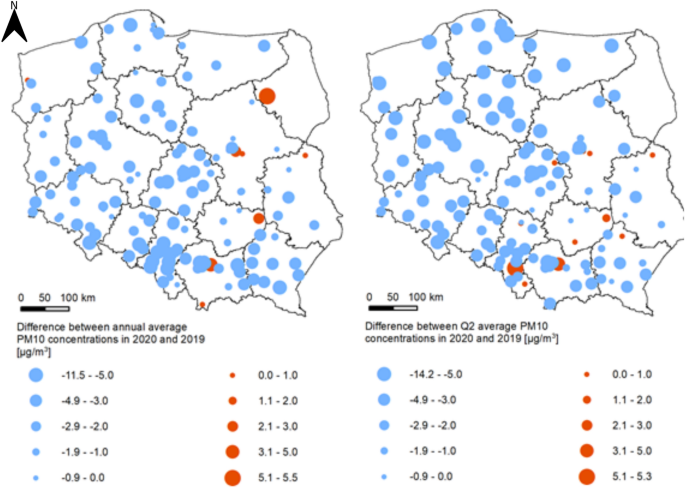
Spatial distribution of differences in PM10 concentrations between 2020 and 2019; left panel—the difference in annual average concentrations, right panel—the difference in Q2 concentrations (Data source: State Environmental Monitoring—Chief Inspectorate of Environmental Protection. Prepared by: IOŚ-PIB)
For selected provinces, changes in PM10 concentrations are particularly pronounced: in the Silesian province, the average decrease was − 4.85 µg/m3, which, given the level of around 34 µg/m3 in 2019, means a decrease of around 14%. In turn, the increase in the Podlaskie province (+ 5.46 µg/m3) compared to the average values from 2019 (approx. 17 µg/m3) constitutes an increase of over 30%, which indicates a local deviation from the national trend and confirms the need for cautious interpretation of results based on data from a single station.
When comparing 2020 and 2019 in terms of PM2.5 concentrations, on average, across the country, there was a decrease—the smallest difference was in the Podlaskie Voivodship.
( − 0.07 µg/m3), the largest in the Podkarpackie Voivodship ( − 4.67 µg/m3). The decreases in the first quarter are mainly due to important differences in February, which was much warmer than the previous year and in which no restrictions had yet been introduced in Poland. The most important decrease in concentrations in the first quarter occurred in the Podkarpackie Voivodship ( − 13.35 µg/m3), as well as in the Śląskie and Opolskie Voivodship ( − 10.25 µg/m3 and − 8.01 µg/m3), respectively. In the second quarter, the values of decreases are smaller and concern other provinces—the most important reduction occurred in the Zachodniopomorskie Voivodship ( − 4.72 µg/m3), Pomorskie Voivodship ( − 4.70 µg/m3) and Warmińsko-Mazurskie Voivodship ( − 4.00 µg/m3). The third quarter was characterised by relatively small differences (except for the Łódzkie Voivodship: − 2.33 µg/m3 and the Pomorskie Voivodship: − 3.6 µg/m3). In the fourth quarter, a downward trend in PM2.5 concentrations prevailed in 2020, resulting mainly from important decreases in October; however, increases prevailed in December.
The reductions in PM2.5 concentrations in 2020 compared to 2019 had similar causes as for PM10 – a mild winter, pandemic restrictions and reduced transport and economic activity. These declines are most visible in the southern provinces, where the share of low emissions is particularly significant. The effects of the lockdown were also visible in the declines recorded at transport stations, which indicates a significant share of the transport sector in generating PM2.5 in urban areas.
The spatial distribution of the differences between annual average PM2.5 concentrations in 2020 and 2019 for individual stations shows that over the majority of the country, there was a reduction in the range of 3—5 µg/m3 on average (Fig. 3). The highest reductions, up to − 6.5 µg/m3, occurred at stations located mainly in the southern and central parts of the country. An increase in concentrations about the previous year was recorded at several stations in the Podlaskie, Lubelskie, Świętokrzyskie, Opolskie and Małopolskie Voivodship. The differences in concentrations in the second quarter of the year are greater in absolute terms. Importantly, the reduction is lower than the annual average in the southern part of the country. In addition, concentrations increased at more stations in the second quarter of 2020. This indicates that the quarantine period did not importantly reduce PM2.5 concentrations between 2020 and 2019.
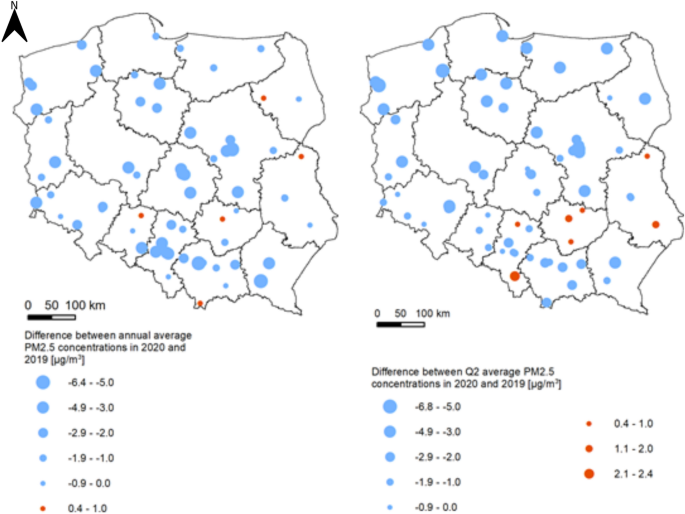
Spatial distribution of differences in PM2.5 concentrations between 2020 and 2019; left panel—the difference in annual average concentrations, right panel—the difference in Q2 concentrations (Data source: State Environmental Monitoring—Chief Inspectorate of Environmental Protection. Prepared by: IOŚ-PIB)
For example, in the Podkarpackie province, the average annual decrease in PM2.5 was − 4.67 µg/m3 – which, compared to the base value of about 23 µg/m3, means a reduction of over 20%. In the Silesian province, the decrease was − 3.07 µg/m3 (about 11%), while in the Opole province it was only − 1.27 µg/m3, which may indicate lower effectiveness of local measures or a greater share of industrial sources, less susceptible to changes in population mobility.
In the case of nitrogen dioxide concentrations, on average in the country, there was a reduction—the smallest in the Podlaskie Voivodship ( − 0.33 µg/m3) and the largest in the Małopolskie Voivodship ( − 3.44 µg/m3). Only the Lubuskie Voivodship showed a concentration increase (1.06 µg/m3). In the first quarter, the decreases were mainly due to important differences in February. It was much warmer in 2020 than 2019, and no restrictions had yet been introduced in Poland.
Concentrations decreased most importantly in the first quarter in the Śląskie Voivodship ( − 4.95 µg/m3) and the Wielkopolskie, Świętokrzyskie, and Opolskie Voivodship ( − 3.67 µg/m3, − 3.47 µg/m3, and − 3.40 µg/m3, respectively). In the second quarter, the values of decreases are smaller and concern other provinces—the largest reduction occurred in the Małopolskie Voivodship ( − 4.12 µg/m3) and Pomorskie Voivodship ( − 3.20 µg/m3). The third quarter was characterised by relatively small differences (except the Lubuskie Voivodship: − 2.23 µg/m3 and the Małopolskie Voivodship: − 2.17 µg/m3). In the fourth quarter, nitrogen dioxide concentrations tended to decrease in 2020, mainly due to large drops in October; only in the Lubuskie Voivodship did concentrations increase by 2.02 µg/m3.
In the case of NO₂, the significant decreases in concentrations in 2020 can be largely attributed to road traffic restrictions introduced in March and April 2020. Since the main source of NO₂ in urban areas is road transport, its reduction directly translated into lower levels of this pollutant – especially in cities. Meteorological conditions, including favourable ventilation in spring 2020, may have had a smaller impact.
The spatial distribution of the differences between the annual average NO2 concentration in 2020 and 2019 for individual stations shows that over the majority of the country, there was a reduction in the range of 2—5 µg/m3 on average (Fig. 4). An increase in concentrations compared to the previous year occurred at several stations in the following voivodship: Lubelskie, Mazowieckie, Podkarpackie, Małopolskie, Kujawsko-Pomorskie, Lubuskie and Zachodniopomorskie. The differences in concentrations in the second quarter of the year are spatially differentiated. Slightly more locations show a positive difference, indicating higher concentrations in 2020, while at other places, the reduction in concentrations in 2020 relative to 2019 is higher than the annual average.
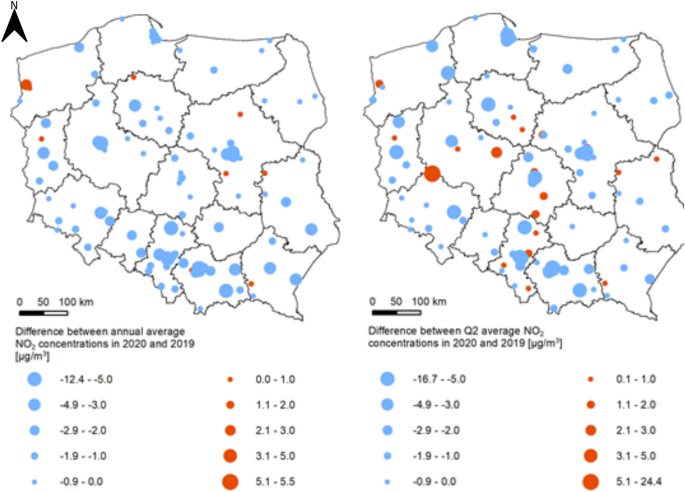
Spatial distribution of differences in nitrogen dioxide concentrations between 2020 and 2019; left panel—the difference in annual average concentrations, right panel—the difference in Q2 concentrations (Data source: State Environmental Monitoring—Chief Inspectorate for Environmental Protection. Prepared by: IOŚ-PIB)
In the Małopolskie province, the decrease in NO₂ concentrations in 2020 reached − 3.44 µg/m3, which in relation to the base level of approx. 25 µg/m3 means a reduction of 13.8%. The greatest relative decreases were recorded in provinces with a large share of urban transport and intensive traffic (Śląskie, Wielkopolskie, Mazowieckie).
Analysis of benzo(a)pyrene concentrations shows that, on average across the country, concentrations increased and decreased between 2020 and 2019. The smallest concentration increase occurred in the Małopolskie and Mazowieckie Voivodship (0.02 ng/m3), the largest in the Podlaskie Voivodship (0.62 ng/m3). In the case of decreases, the largest decrease in benzo(a)pyrene concentrations occurred in the Lubuskie Voivodship ( − 1.57 ng/m3). In the first quarter, the reductions were mainly due to important differences in February, which was much warmer in 2020 than in 2019, and restrictions were not yet in place in Poland. The most important decrease in concentrations in the first quarter occurred in the Śląskie Voivodship ( − 4.05 ng/m3) and also in the Lubuskie and Pomorskie Voivodship ( − 3.09 ng/m3 and − 2.94 ng/m3), respectively. In the second quarter, the values of concentrations of benzo(a)pyrene increased; the highest increase occurred in the Voivodship Lubelskie (1.37 ng/m3), Łódzkie (0.84 ng/m3) and Pomorskie (0.83 ng/m3). A decrease occurred only in the Lubuskie Voivodship ( − 0.52 ng/m3). The third quarter was characterised by relatively small differences—concentrations in 2020 were mostly lower, except for the Warmińsko-Mazurskie Voivodship, where concentrations increased by 0.31 ng/m3. In the fourth quarter, in the majority of voivodship, there was a decreasing tendency of benzo(a)pyrene concentrations in 2020; the most important decrease concerned the Lubuskie Voivodship ( − 2.69 ng/m3), whereas the highest increase occurred in the Dolnośląskie Voivodship (2.65 ng/m3).
Changes in benzo(a)pyrene concentrations did not have a clear direction, which may be due to the fact that the sources of this compound are closely related to the individual heating sector (burning of biomass and coal), which was subject to pandemic restrictions to a small extent. Increases noted in some regions (e.g. Podlaskie, Kujawsko-pomorskie) may result from local meteorological conditions (e.g. inversions) or changes in the structure of fuels used by households. Further analyses of correlation with local anti-smog policies are needed.
The spatial distribution of the differences between annual average benzo(a)pyrene concentrations in 2020 and 2019 for individual stations shows that in the predominant area of the voivodship of Podkarpackie, Śląskie, Opolskie, Łódzkie, Lubuskie, Pomorskie and Warmińsko-Mazurskie there was a reduction on average in the range of 0.5–1.0 ng/m3 (Fig. 5). An increase in concentrations compared to the previous year occurred at stations in the following voivodship: Podlaskie, Mazowieckie, Lubelskie, Małopolskie, Dolnośląskie, Kujawsko-Pomorskie and Wielkopolskie. Differences in concentrations between 2020 and 2019 in the year’s second quarter show an increase at most stations.
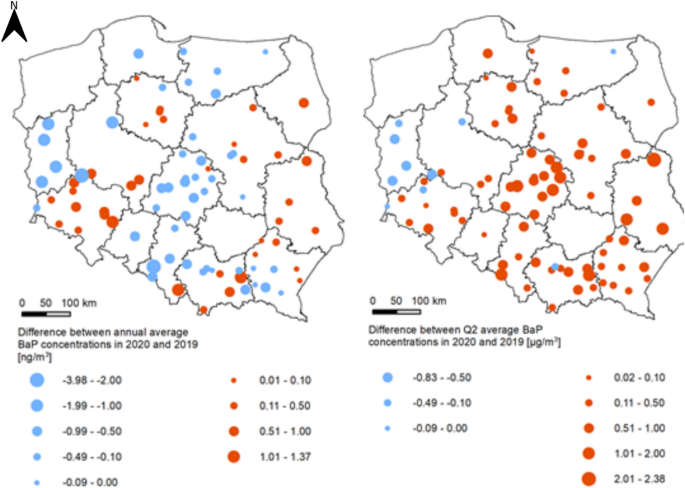
Spatial distribution of differences in benzo(a)pyrene concentrations between 2020 and 2019; left panel—the difference in annual average concentrations, right panel—the difference in Q2 concentrations (Data source: State Environmental Monitoring—Chief Inspectorate for Environmental Protection. Prepared by: IOŚ-PIB)
Change in concentrations at traffic, urban background and non-urban background stations
Most stations measuring benzo(a)pyrene belong to a single type, so the following analysis has been carried out for PM10, PM2.5 and NO2. Where reference is made to “urban stations”, these are only urban background stations, excluding traffic stations, which form a separate category in the analysis.
PM10
About 2018, a decrease in annual mean PM10 concentrations was marked at all station types. The trend continued between 2019 and 2020 for traffic stations, while the trend was slightly weaker for the other station types. This may support the thesis of the impact of reduced travel in urban areas on the levels of PM10 concentrations measured within the range of influence of traffic routes. At the same time, this may result from reduced secondary lift due to a hot winter during which no sanding and salting of streets took place. The downward trend at non-urban stations is relatively the weakest (Fig. 6).
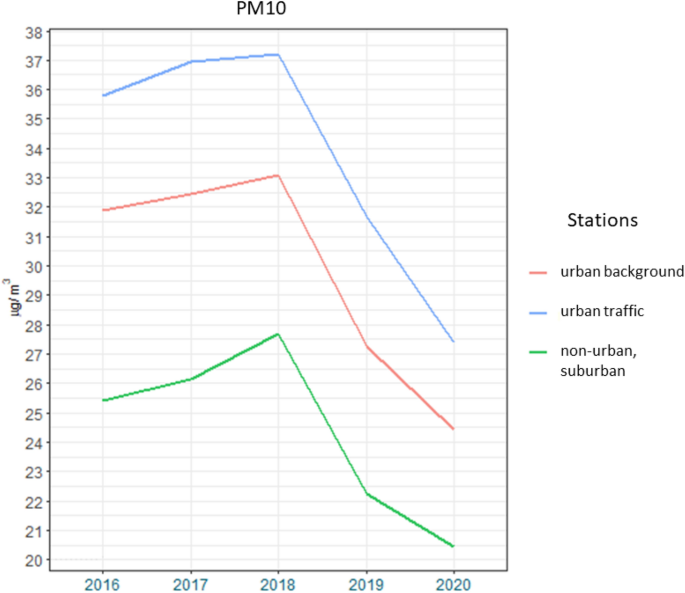
Average annual concentration of PM10 dust in Poland in the period 2016—2020 at urban background stations—red line, at non-urban stations—green line, at communication (urban)- blue line (Data source: State Environmental Monitoring—Chief Inspectorate of Environmental Protection. Prepared by IOŚ-PIB)
The analysis of the variability of monthly PM10 concentrations in 2020, taking into account station types, shows that there are differences of a systematic nature. However, the decrease in concentrations from March to May at urban and traffic (urban) background type stations shows a slightly higher gradient than at non-urban stations (Fig. 7). Comparing 2020 and the average of the last 5 years, the most important difference in PM10 concentrations occurred at traffic stations, which may be related to the quarantine period and reduced car traffic in urban areas.
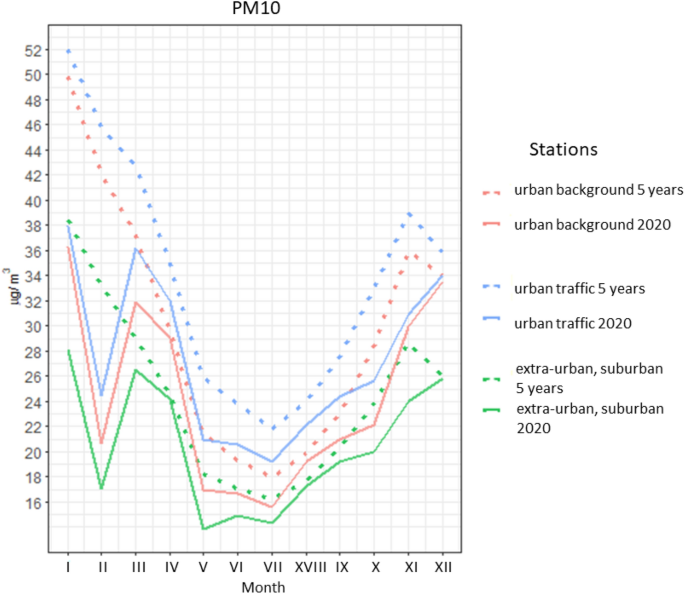
Average monthly concentrations of PM10 dust in Poland in 2020 (solid line) and averaged for the period 2016—2020 (dashed line) at urban background stations—red line, at non-urban stations—green line, at transport (urban) stations—blue line (Data source: State Environmental Monitoring—Main Inspectorate for Environmental Protection. Prepared by IOŚ-PIB)
The differences between PM10 concentrations in the second and fourth quarters of 2020 compared to the corresponding quarter of 2019 are shown in Table 5. Differences are given for stations of different types—non-urban, suburban and urban (including traffic). Differences are also included for March, in the middle of which restrictions were introduced, and there was an increase in concentrations in 2020 compared to the previous year. The decrease in concentrations is more important in the second quarter of 2020 and weaker in the fourth quarter due to the increase in concentrations recorded in December and March 2020, marked increases in PM10 concentrations compared to 2019.
PM2.5
Since 2018, annual mean concentrations of PM2.5 at all station types have importantly decreased, although the trend has continued since 2017. The variability is very similar to PM10 (Fig. 8).
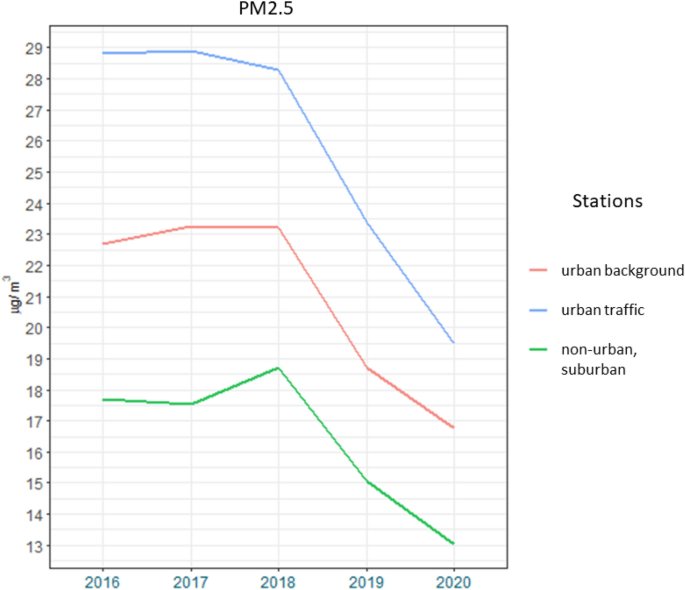
Annual average concentrations of PM2.5 in Poland in the period 2016—2020 at urban background stations—red line, at non-urban stations—green line, at transport (urban) stations—blue line (Data source: State Environmental Monitoring—Chief Inspectorate of Environmental Protection. Prepared by IOŚ-PIB)
The analysis of the variability of monthly average PM2.5 concentrations in 2020, taking into account station types, shows that there are differences of a systematic nature. However, the decrease in concentrations from March to May at urban and traffic (urban) background type stations shows a slightly greater gradient than at non-urban stations (Fig. 9). The highest difference in PM2.5 concentrations in 2020 compared to the average of the last 5 years occurred at traffic stations, which may be related to the quarantine period and reduced traffic in urban areas.
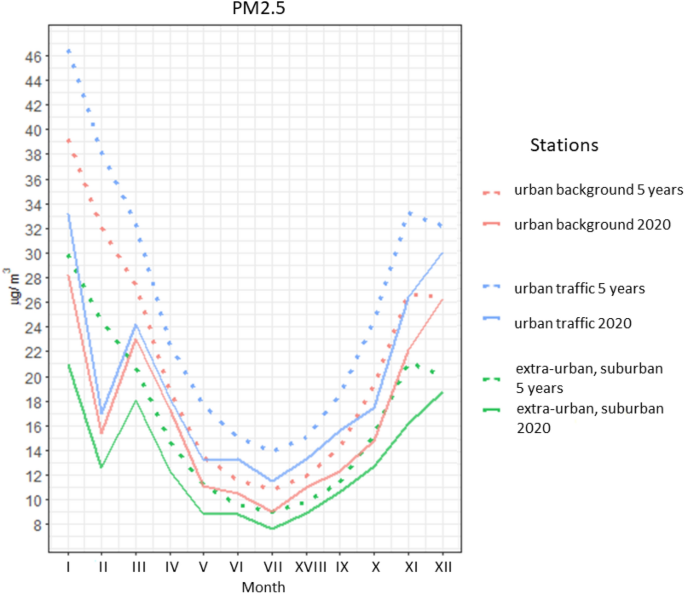
Average monthly concentrations of PM2.5 in Poland in 2020 (solid line) and averaged for the period 2016—2020 (dashed line) at urban background stations—red line, at non-urban stations—green line, at transport (urban) stations—blue line (Data source: State Environmental Monitoring—Main Inspectorate for Environmental Protection. Prepared by IOŚ-PIB)
Table 6 shows the differences between PM2.5 concentrations in the second and fourth quarters of 2020 and the corresponding quarter of 2019. Differences are also included for March, during which restrictions were introduced, and concentrations increased in 2020 compared to the previous year. Only suburban stations showed harmful concentration decreases in the fourth quarter for all three months. At urban background stations, concentrations in November and December of 2020 were higher than in the previous year.
NO2
For NO2, the downward trend has continued since the beginning of the analysed period in 2016. While the differences are not important for non-urban stations, and a slight decrease has been recorded for urban background stations since 2018, the variability at traffic stations shows an apparent decline in values in 2020 (Fig. 10).
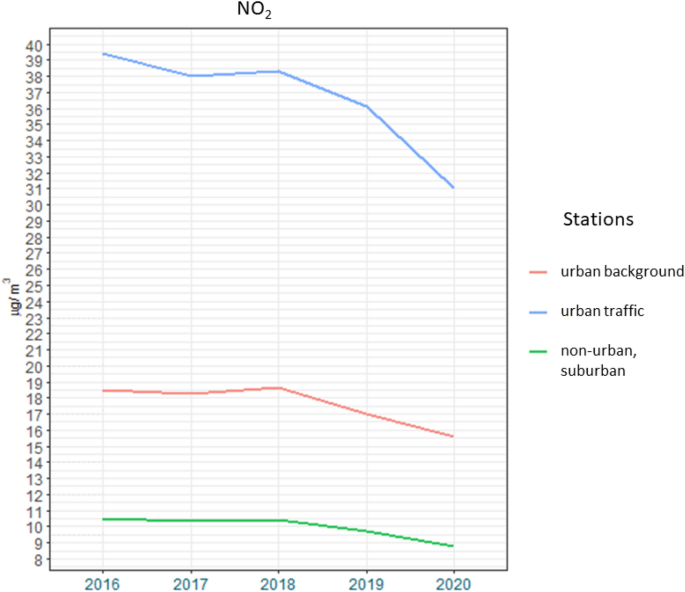
Annual average NO2 in Poland in the period 2016—2020, at urban background stations—red line, at non-urban stations—green line, at transport (urban) stations—blue line (Data source: State Environmental Monitoring—Chief Inspectorate of Environmental Protection. Prepared by IOŚ-PIB)
The analysis of the variability of nitrogen dioxide concentrations in 2020, taking into account station types, shows that there are differences of a systematic nature. However, the decrease in concentrations from March to May at stations of the urban background and traffic (urban) type shows a greater gradient than at non-urban stations (Fig. 11). The highest difference in NO2 concentrations in 2020 compared to the average of the last 5 years occurred at traffic stations, which may be related to the quarantine period and reduced traffic in urban areas.
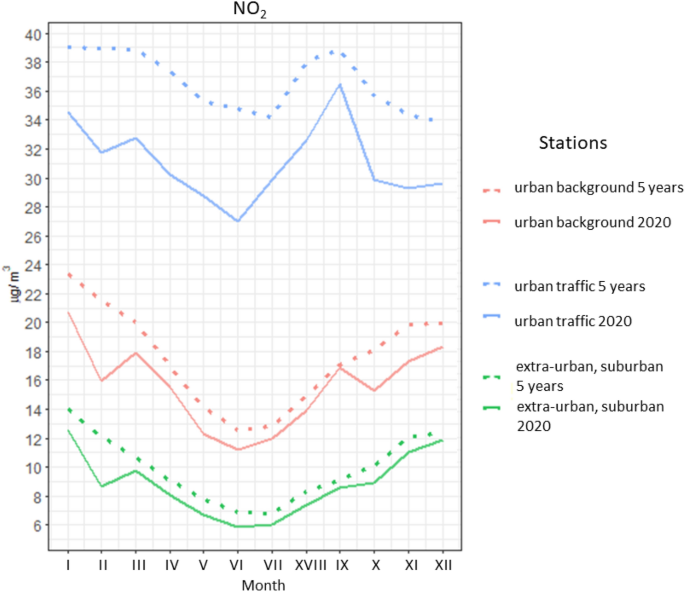
Average monthly concentrations of nitrogen dioxide in Poland in 2020 (solid line) and averaged for the period 2016—2020 (dashed line) at urban background stations—red line, at non-urban stations—green line, at transport (urban) stations—blue line (Data source: State Environmental Monitoring—Main Inspectorate for Environmental Protection. Prepared by IOŚ-PIB)
Table 7 shows the differences between NO2 concentrations in the second and fourth quarters of 2020 compared to the corresponding quarter of 2019. It also includes the differences for March, in the middle of which restrictions were introduced, in which concentrations increased in 2020 compared to the previous year. The relatively important decrease in concentrations at urban and suburban stations in the fourth quarter is due to the reduction in October.