
 One-Off $578M Loss Sparks Margin Quality Debate")
Chord Energy (CHRD) posted net profit margins of 5.3% for the twelve months leading up to September 30, 2025, down sharply from 22.2% a year earlier. This decline was largely driven by a one-off $578 million loss that weighed on earnings results for the period. Looking ahead, investors are weighing the short-term margin pressure and non-recurring losses against robust forward-looking projections. Annual earnings growth of 37.2% is expected and could outpace the broader US market.
See our full analysis for Chord Energy.
Next, we’ll see how these earnings numbers stack up against the prevailing narratives. Some stories will get confirmed, while others could be in for a rethink.
See what the community is saying about Chord Energy
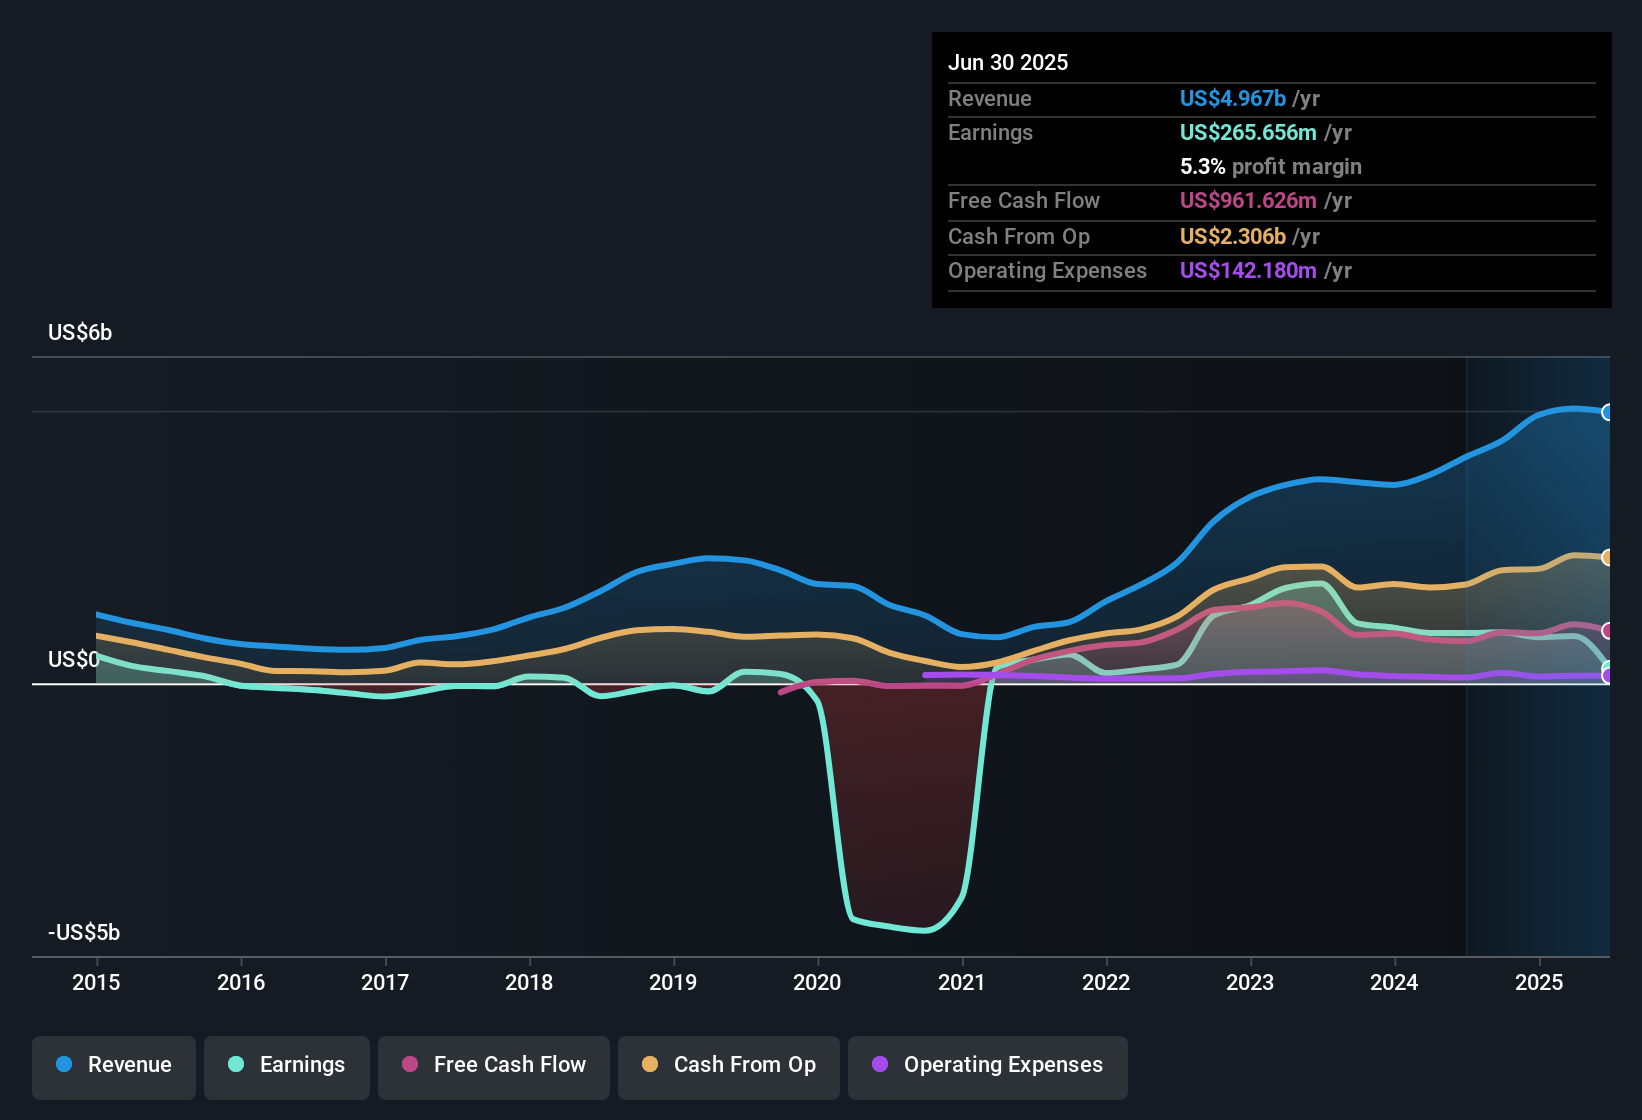 NasdaqGS:CHRD Earnings & Revenue History as at Nov 2025 Margin Forecast Jumps to 23.2%
- Analysts expect net profit margins to expand from 5.3% now to 23.2% within three years, even as revenue is forecast to shrink by 4.3% annually in the same period.
- According to the analysts’ consensus view, margin expansion is seen as evidence of Chord Energy’s operational efficiency and disciplined capital spending.
- Advanced analytics and capital allocation are highlighted as drivers, offsetting the drag from recent non-recurring losses and declining top-line growth.
- Consensus notes this combination allows for robust free cash flow and supports management’s target of a 90%+ payout ratio. This reinforces the story that profitability improvements, rather than top-line growth, are now the core of the bullish thesis.
- To see how analysts interpret these margin moves in the bigger picture, check out their full view in the consensus narrative below. 📊 Read the full Chord Energy Consensus Narrative.
Share Decline Drives EPS Upside
- The number of shares outstanding is projected to drop by 6.33% per year over the next three years, amplifying per-share earnings growth even as revenue contracts.
- Analysts’ consensus view points out this share reduction sharpens the EPS growth profile.
- Combined with cost improvements, the declining share count helps explain why earnings per share are expected to reach $14.75 by 2028, which is over three times the current level even with modest revenue pressure.
- This trend supports the argument that Chord’s buybacks and capital returns underpin the company’s valuation strengths and help mitigate the impact of stagnant revenues on shareholder returns.
Valuation Discount to DCF Fair Value
- Chord Energy’s current share price of $84.99 trades at a deep discount to its estimated DCF fair value of $385.33. It also sits below the analyst consensus price target of $129.82.
- Analysts’ consensus notes the undervaluation widens the potential return range.
- Although the price-to-earnings multiple of 22.1x is higher than the industry average, it is projected to compress to 7.6x by 2028 as earnings ramp up and margins recover.
- This discount challenges bears’ concerns around earnings quality and recent margin pressure. It suggests the market is already pricing in risks from non-recurring losses and may offer upside if Chord achieves forecasted profitability gains.
Next Steps
To see how these results tie into long-term growth, risks, and valuation, check out the full range of community narratives for Chord Energy on Simply Wall St. Add the company to your watchlist or portfolio so you’ll be alerted when the story evolves.
Do you view the data from another angle? In just a few minutes, you can turn that perspective into your own narrative. Do it your way
A great starting point for your Chord Energy research is our analysis highlighting 3 key rewards and 4 important warning signs that could impact your investment decision.
See What Else Is Out There
Despite recovering profit margins, Chord Energy faces shrinking revenue and recent non-recurring losses. These factors cast doubt on the consistency of future growth.
If you’re looking for steadier performance regardless of market swings, check out companies showing reliable growth with stable growth stocks screener (2073 results) that could better fit your investment strategy.
This article by Simply Wall St is general in nature. We provide commentary based on historical data
and analyst forecasts only using an unbiased methodology and our articles are not intended to be financial advice. It does not constitute a recommendation to buy or sell any stock, and does not take account of your objectives, or your
financial situation. We aim to bring you long-term focused analysis driven by fundamental data.
Note that our analysis may not factor in the latest price-sensitive company announcements or qualitative material.
Simply Wall St has no position in any stocks mentioned.
Our new AI Stock Screener scans the market every day to uncover opportunities.
• Dividend Powerhouses (3%+ Yield)
• Undervalued Small Caps with Insider Buying
• High growth Tech and AI Companies
Or build your own from over 50 metrics.
Have feedback on this article? Concerned about the content? Get in touch with us directly. Alternatively, email editorial-team@simplywallst.com