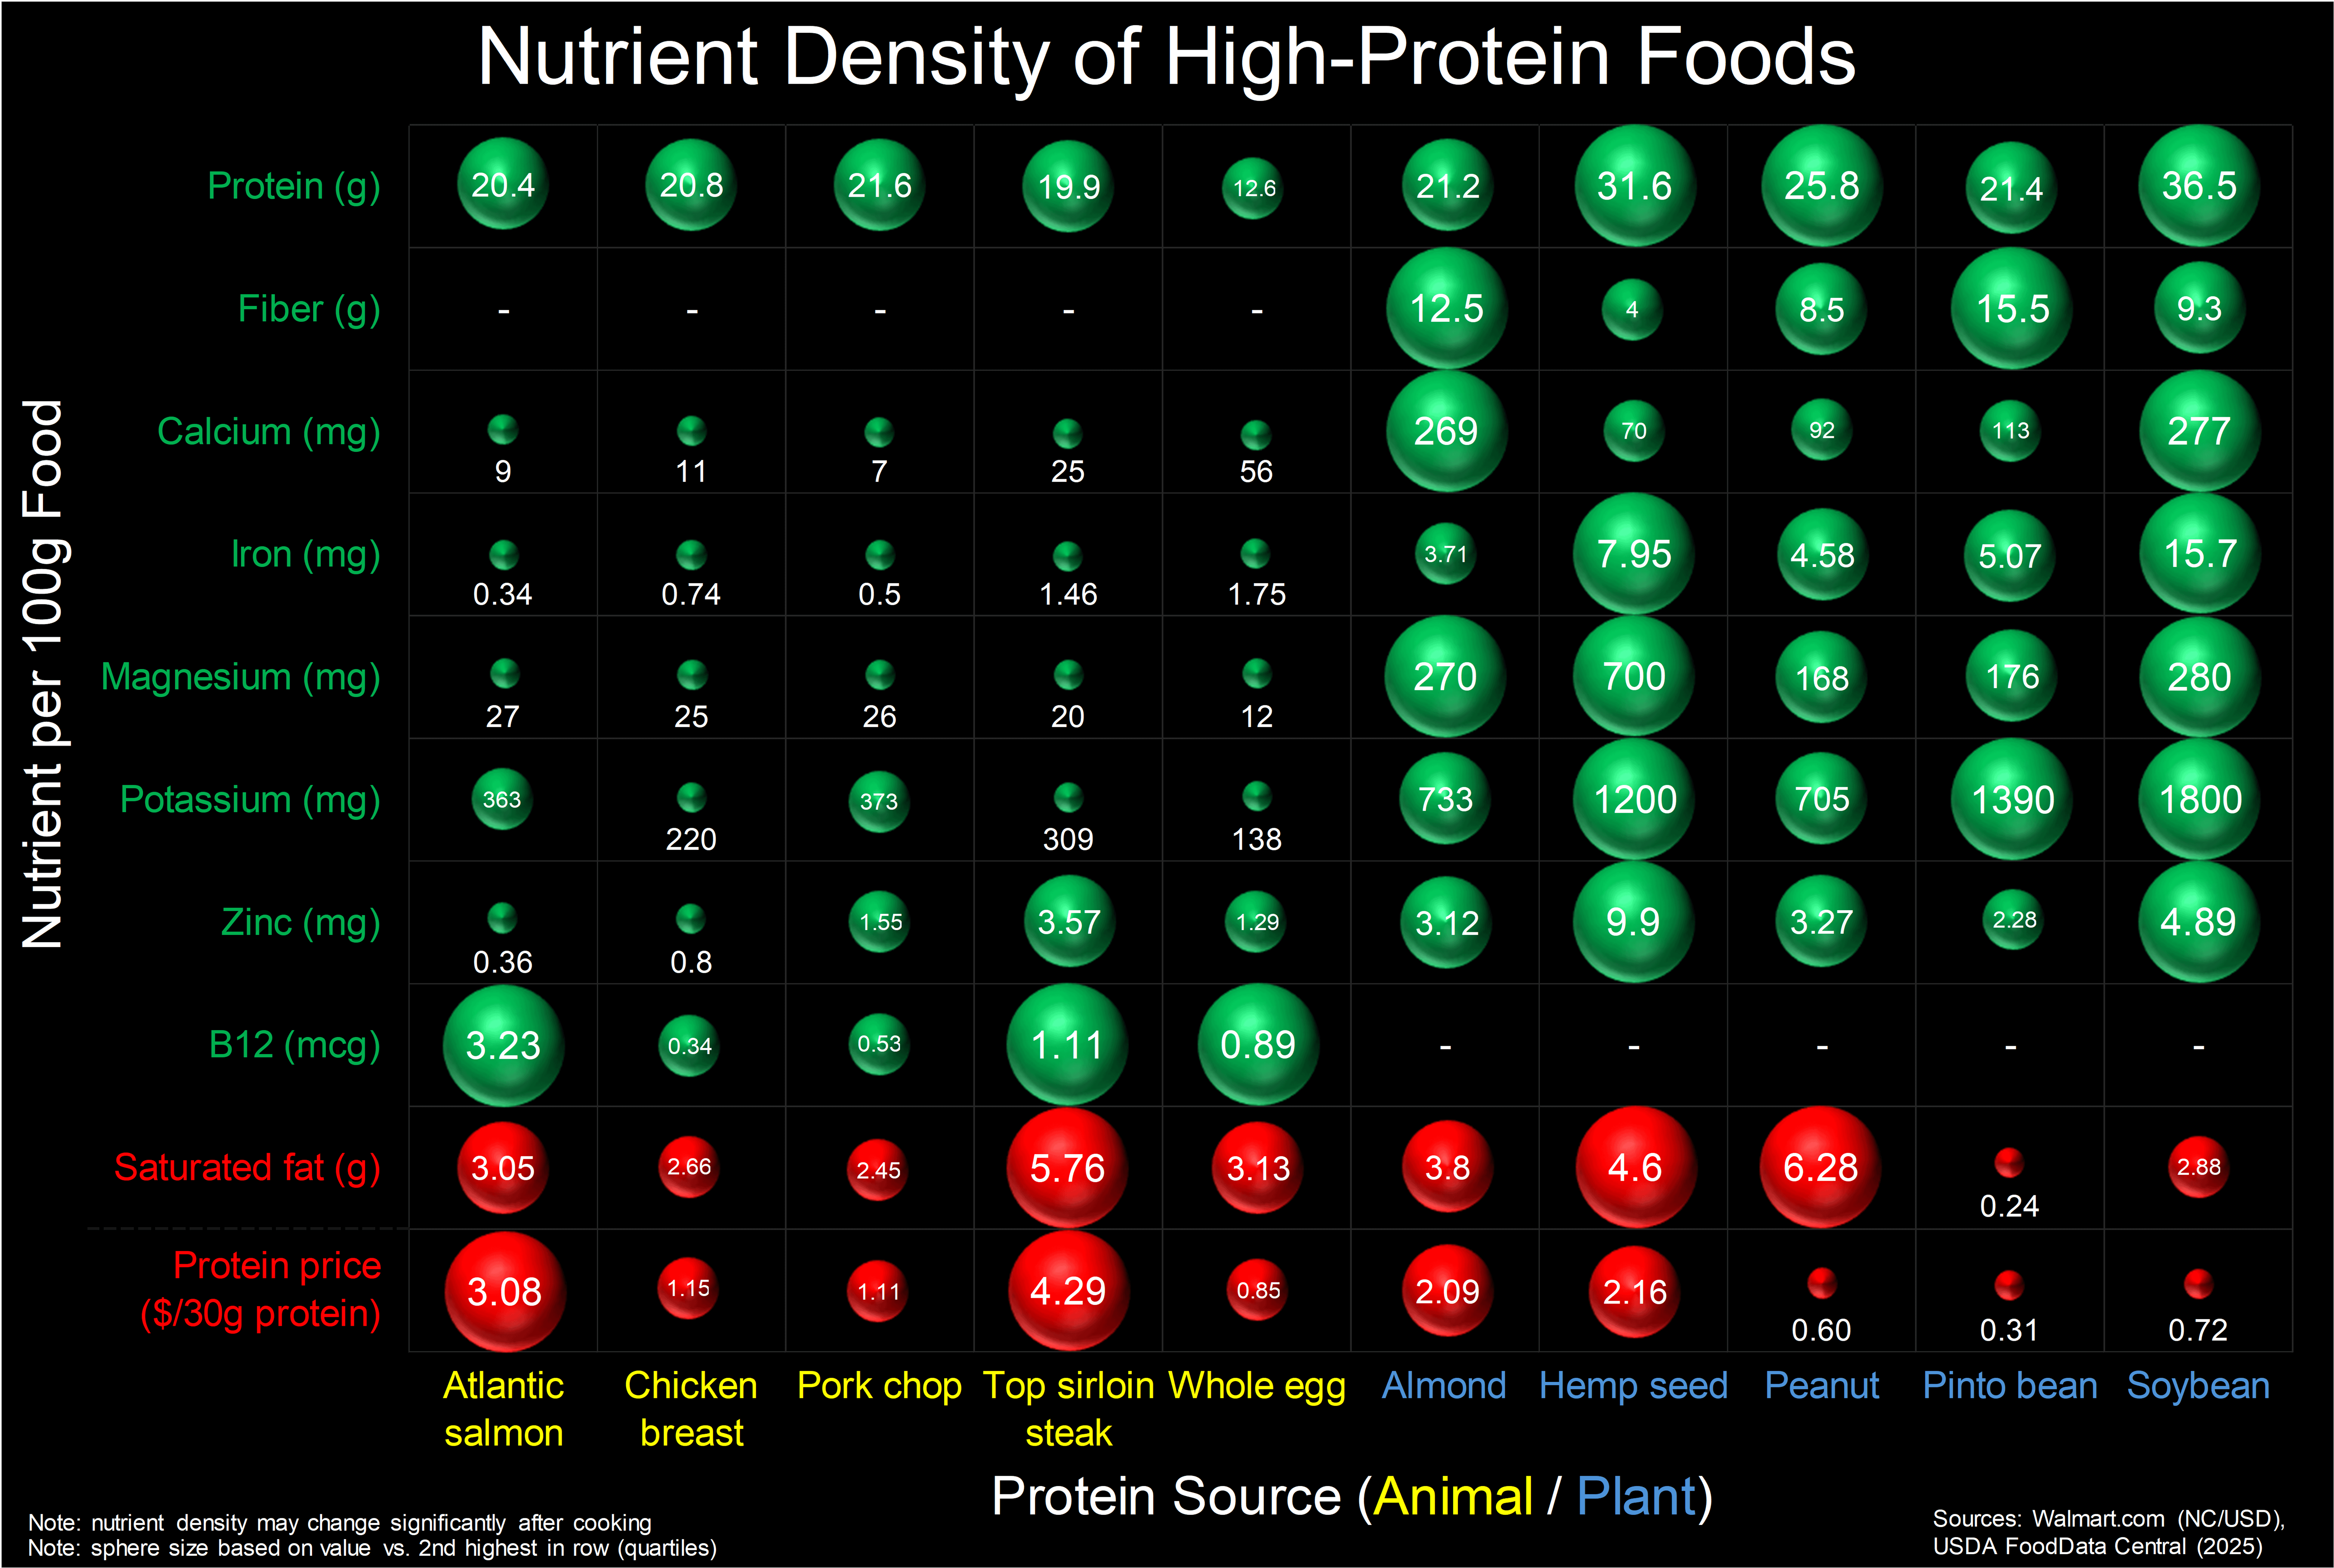
I guess vegetarian people should definitely take B12 supplements.
Veganeconow on
What a great chart! Really ends the debate, doesn’t it? Plants for the win!!!
NotAFanOfFun on
this isn’t a helpful comparison because the animal sources have a lot more water weight. a better comparison is either nutrient density by dry weight or by calories
zolbear on
Something is off. A simple Google search of 1kg of almonds vs 1kg of chicken breast protein content will tell you that there’s almost 50% more in the latter (210g vs 310g). Top sirloin should be 270g and pork chops 240-260g (depending on source).
RoozGol on
No love for lentils? They have the highest protein.
theother64 on
Weird you didn’t include calories hemp seeds look great until you realise they are as calorie dense as chocolate.
Edit: also your comparing uncooked foods. Once you cook these you lose about half for things like beans whilst close to a 1/3 for meat.
PaulOshanter on
Aren’t animal sources of protein a lot more bioavailable?
jcooper34 on
There is a also the issue of bioavailability.
Ewan_Derstand on
Interesting stuff. Could you do the same chart for common dairy products and their non-dairy alternatives?
Ulnar_Landing on
Why include only 2 of the 3 macros?
This is a cool chart, but I think it’s a little misleading about how good of a source of protein the plant sources are. It’s really hard to eat much of them and some are not complete proteins (although most in your chart are)
Fanass on
Don’t forget the main point: assimilation. Salmon and almonds make a big difference, for example…
syn_miso on
Carnivore diet people seething rn
SleepyMonkey7 on
A little weird to compare macros and vitamins on the same scale. Serve different purposes and one is being measured with a mass 1000x of the other.
Scoobenbrenzos on
I’d like to apologize to soy, I wasn’t familiar with your game
Anomalous_Creation on
I know this is a government psyop to forcefeeed me soy products…I just can’t prove it.
jimjamiam on
This would be more interesting normalizing by calories
chattywww on
if you going to use a circle to represent a value you should make it proportional to area and radius
_marimbae on
I love eating nuts and seeds, I feel like a little bird
Llamasxy on
This is a good example of how real data can be used to influence someone to a false conclusion.

![[OC] Nutrient Density of High-Protein Foods](https://www.byteseu.com/wp-content/uploads/2025/11/jtsicdj6ze1g1-1536x1032.png "[OC] Nutrient Density of High-Protein Foods")
21 Comments
Sources (2025):
1. Walmart for pricing (North Carolina region): [https://www.walmart.com/](https://www.walmart.com/)
2. USDA FoodData Central for nutrient density: [https://fdc.nal.usda.gov/](https://fdc.nal.usda.gov/) ([Atlantic salmon](https://fdc.nal.usda.gov/food-details/175167/nutrients), [Chicken breast](https://fdc.nal.usda.gov/food-details/171474/nutrients), [Pork chop](https://fdc.nal.usda.gov/food-details/167839/nutrients), [Top sirloin steak](https://fdc.nal.usda.gov/food-details/168728/nutrients), [Whole egg](https://fdc.nal.usda.gov/food-details/171287/nutrients), [Almond](https://fdc.nal.usda.gov/food-details/170567/nutrients), [Hemp seed](https://fdc.nal.usda.gov/food-details/170148/nutrients), [Peanut](https://fdc.nal.usda.gov/food-details/172430/nutrients), [Pinto bean](https://fdc.nal.usda.gov/food-details/175199/nutrients), [Soybean](https://fdc.nal.usda.gov/food-details/174270/nutrients))
Tool: Microsoft Excel
[deleted]
I guess vegetarian people should definitely take B12 supplements.
What a great chart! Really ends the debate, doesn’t it? Plants for the win!!!
this isn’t a helpful comparison because the animal sources have a lot more water weight. a better comparison is either nutrient density by dry weight or by calories
Something is off. A simple Google search of 1kg of almonds vs 1kg of chicken breast protein content will tell you that there’s almost 50% more in the latter (210g vs 310g). Top sirloin should be 270g and pork chops 240-260g (depending on source).
No love for lentils? They have the highest protein.
Weird you didn’t include calories hemp seeds look great until you realise they are as calorie dense as chocolate.
Edit: also your comparing uncooked foods. Once you cook these you lose about half for things like beans whilst close to a 1/3 for meat.
Aren’t animal sources of protein a lot more bioavailable?
There is a also the issue of bioavailability.
Interesting stuff. Could you do the same chart for common dairy products and their non-dairy alternatives?
Why include only 2 of the 3 macros?
This is a cool chart, but I think it’s a little misleading about how good of a source of protein the plant sources are. It’s really hard to eat much of them and some are not complete proteins (although most in your chart are)
Don’t forget the main point: assimilation. Salmon and almonds make a big difference, for example…
Carnivore diet people seething rn
A little weird to compare macros and vitamins on the same scale. Serve different purposes and one is being measured with a mass 1000x of the other.
I’d like to apologize to soy, I wasn’t familiar with your game
I know this is a government psyop to forcefeeed me soy products…I just can’t prove it.
This would be more interesting normalizing by calories
if you going to use a circle to represent a value you should make it proportional to area and radius
I love eating nuts and seeds, I feel like a little bird
This is a good example of how real data can be used to influence someone to a false conclusion.