

Figure 1 shows a flowchart of the study cohort. A total of 22,260 individuals underwent health check-ups between April 2008 and March 2023. Of these, 2727 participants with blood pressure abnormalities, 1506 with glucose metabolism abnormalities, and 3793 with lipid metabolism abnormalities were included in the analysis after applying the eligibility criteria.
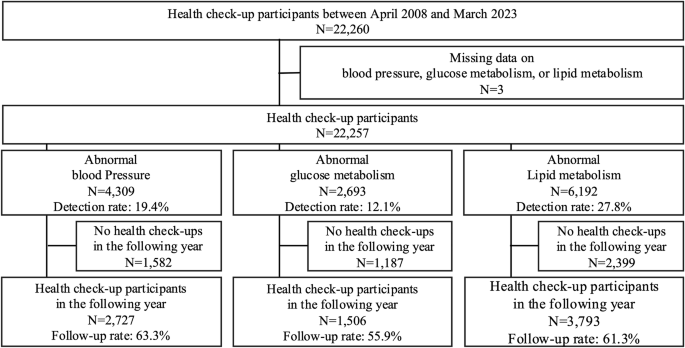
Flowchart defining the study cohort
Table 1 shows the baseline characteristics of the participants. Participants with blood pressure abnormalities had a mean age of 55.4 ± 9.0 years, 71.1% were males, and 35.1% were on antihypertensive medication. Participants with glucose metabolism abnormalities had a mean age of 55.8 ± 8.5 years, 74.9% were males, and 25.6% were on antidiabetic medication. Participants with lipid metabolism abnormalities had a mean age of 52.4 ± 8.7 years, 61.0% were males, and 8.4% were on antihyperlipidaemic medication. The proportion of participants with obesity (BMI ≥ 25 kg/m2) was 46.5% for blood pressure abnormalities, 54.5% for glucose metabolism abnormalities, and 39.0% for lipid metabolism abnormalities, whereas the proportion of underweight individuals (BMI < 18.5 kg/m2) was 1.7%, 1.9%, and 1.7%, respectively.
Blood pressure abnormalities
Figure 2 shows blood pressure distribution at baseline and at the subsequent check-up among the 2727 individuals with blood pressure abnormalities. The mean SBP was 153.1 ± 11.1 mmHg and DBP was 95.8 ± 7.9 mmHg. Both the SBP and DBP decreased significantly by 8.6 mmHg (95% CI, 8.0–9.1; p < 0.001) and 5.1 mmHg (95% CI, 4.7–5.4; p < 0.001), respectively, at the subsequent check-up. Among individuals with baseline SBP of ≥160 mmHg, the reduction was more pronounced, with SBP decreasing by 17.2 mmHg (95% CI, 16.0–18.4; p < 0.001; Supplementary Fig. 1). Overall, 57.4% of the individuals showed improvement in blood pressure abnormalities at the subsequent check-up (Fig. 3). Figure 4 shows the factors associated with improvement at the subsequent check-up, based on a logistic regression analysis. Improvement in blood pressure abnormalities was significantly associated with older age (OR, 1.12 [per 10 years]; 95% CI, 1.01–1.23; p = 0.03), female sex (OR, 0.71 for male sex; 95% CI, 0.58–0.88; p = 0.001), lower baseline SBP (OR, 0.65 [per 10 mmHg]; 95% CI, 0.60–0.70; p < 0.001), non-use of antihypertensive medication at the baseline check-up (OR, 0.38 for use of antihypertensive medication at the baseline check-up; 95% CI, 0.29–0.49; p < 0.001), use of antidiabetic and/or antihyperlipidaemic medication at the baseline check-up (OR, 1.35; 95% CI, 1.07–1.69; p = 0.010), weight loss (OR, 1.08; 95% CI, 1.05–1.10; p < 0.001), and use of antihypertensive medication at the subsequent check-up (OR, 2.22; 95% CI, 1.75–2.82; p < 0.001). Mean (range) VIF for this model was 1.35 (1.02–2.24), indicating that multicollinearity was unlikely to have affected the results.
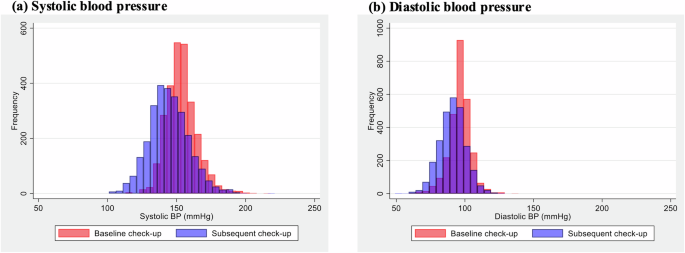
Distribution of blood pressure at baseline and the subsequent check-up among individuals with blood pressure abnormalities. Red bars represent baseline measurements and blue bars represent subsequent check-up measurements of a systolic and b diastolic blood pressures. BP blood pressure
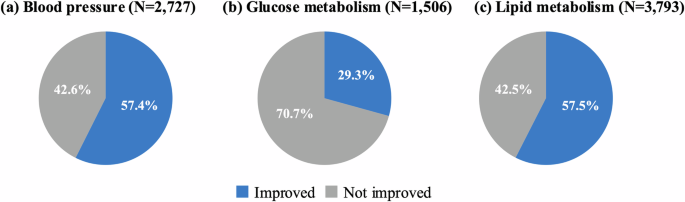
Proportion of individuals with improvement in abnormalities at the subsequent check-up. Blue segments represent participants who showed improvements in abnormalities, and grey segments represent those who did not show improvement in abnormalities of a blood pressure, b glucose metabolism, and c lipid metabolism
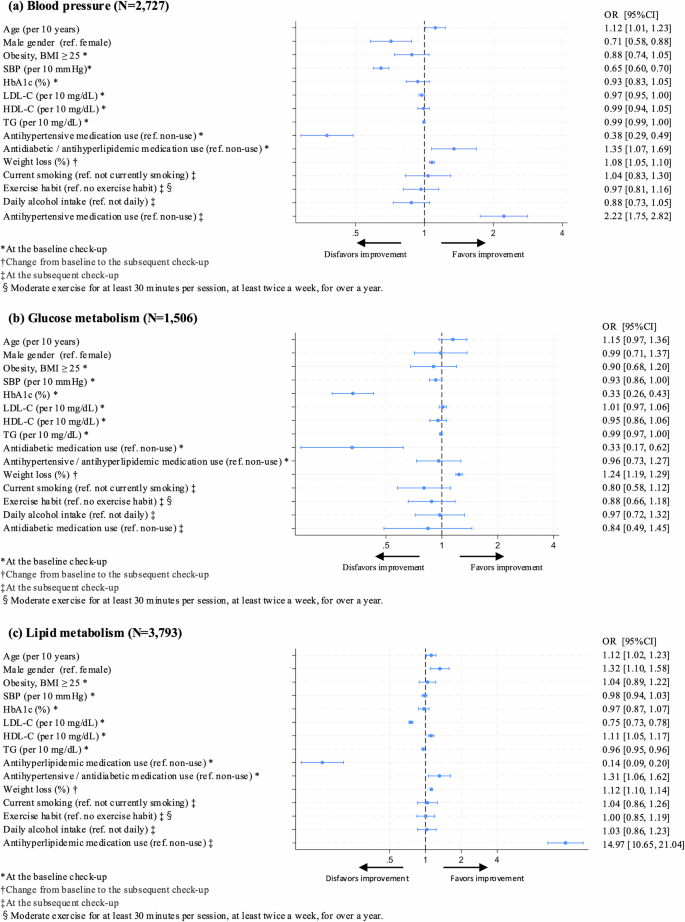
Factors associated with improvement in abnormalities at the subsequent check-up. Odds ratios for improvement in abnormalities at the subsequent check-up were calculated using logistic regression models for a blood pressure, b glucose metabolism, and c lipid metabolism. The following variables were included as explanatory variables: baseline characteristics (age, sex, obesity status [BMI < 25 or ≥ 25 kg/m2], SBP, HbA1c, LDL-C, HDL-C, triglycerides, use of antihypertensive, antidiabetic and/or antihyperlipidaemic medications, weight loss, and variables at the subsequent check-up (current smoking status, exercise habits, daily alcohol intake, and use of relevant medication). *Variables at the baseline check-up. †Change from baseline to the subsequent check-up. ‡Variables at the subsequent check-up. §Exercise habit was defined as engaging in moderate exercise for at least 30 min per session, at least twice a week, for >1 year. BMI body mass index, CI confidence interval, HbA1c haemoglobin A1c, HDL-C high-density lipoprotein cholesterol, LDL-C low-density lipoprotein cholesterol, OR odds ratio, SBP systolic blood pressure, TG triglycerides
Glucose metabolism abnormalities
Among the 1506 individuals with glucose metabolism abnormalities, the distribution of HbA1c at baseline and the subsequent check-up largely overlapped (Supplementary Fig. 2), and there was no significant difference observed (mean difference, 0.02%; 95% CI, −0.02 to 0.07, p = 0.336). However, among 385 individuals with HbA1c of ≥7.0% at the baseline check-up, HbA1c decreased significantly by 0.3% (95% CI, 0.17–0.47; p < 0.001). Overall, 29.3% of the individuals showed improvement in glucose metabolism abnormalities at the subsequent health check-up (Fig. 3). Logistic regression analysis showed that lower baseline HbA1c (OR, 0.33 for HbA1c; 95% CI, 0.26–0.43; p < 0.001), non-use of antidiabetic medication at the baseline check-up (OR, 0.33 for use of antidiabetic medication at the baseline check-up; 95% CI, 0.17–0.62; p = 0.001), and weight loss (OR, 1.24; 95% CI, 1.19–1.29; p < 0.001) were significantly associated with improvement in glucose metabolism abnormalities at the subsequent check-up (Fig. 4). Mean (range) VIF for this model was 1.45 (1.06–3.03), indicating that multicollinearity was unlikely to have affected the results.
Lipid metabolism abnormalities
Among the 3793 individuals with lipid metabolism abnormalities, 3135 (82.7%) had LDL-C abnormalities, 572 (15.1%) had triglyceride abnormalities, 181 (4.8%) had HDL-C abnormalities, and 95 had multiple lipid abnormalities. LDL-C and triglycerides levels decreased significantly from baseline to the subsequent check-up by 18.5 mg/dL (95% CI, 17.5–19.5; p < 0.001) and 154.9 mg/dL (95% CI, 138.7–171.1; p < 0.001), respectively, while HDL-C significantly increased by 4.5 mg/dL (95% CI, 3.7–5.3; p < 0.001) (Supplementary Fig. 3). At the subsequent check-up, 57.5% of the participants showed improvement in lipid metabolism abnormalities (Fig. 3), including 57.7% of those with LDL-C abnormalities, 73.1% with triglyceride abnormalities, and 67.4% with HDL-C abnormalities. Logistic regression analysis showed that older age (OR, 1.12 [per 10 years]; 95% CI, 1.02–1.23; p = 0.016), male sex (OR, 1.32; 95% CI, 1.10–1.58; p = 0.002), lower baseline LDL-C (OR, 0.75 [per 10 mg/dL]; 95% CI, 0.73–0.78; p < 0.001) or triglyceride (OR, 0.96 [per 10 mg/dL]; 95% CI, 0.95–0.96; p < 0.001), higher baseline HDL-C (OR, 1.11 [per 10 mg/dL]; 95% CI, 1.05–1.17; p < 0.001), non-use of antihyperlipidaemic medication at the baseline check-up (OR, 0.14 for use of antihyperlipidaemic medication at the baseline check-up; 95% CI, 0.09–0.20; p < 0.001), use of antihypertensive and/or antidiabetic medication at the baseline check-up (OR, 1.31; 95% CI, 1.06–1.62; p = 0.013), weight loss (OR, 1.12; 95% CI, 1.10–1.14; p < 0.001), and use of antihyperlipidaemic medication at the subsequent check-up (OR, 14.97; 95% CI, 10.65–21.04; p < 0.001) were significantly associated with improvement in lipid metabolism abnormalities at the subsequent check-up (Fig. 4). When LDL-C and triglyceride abnormalities were analysed separately, the use of antihyperlipidaemic medication at both baseline and subsequent check-up was significantly associated with improvement in LDL-C (baseline: OR, 0.10; 95% CI, 0.06–0.17; p < 0.001; subsequent check-up: OR, 30.34; 95% CI, 19.49–47.25; p < 0.001), whereas no significant association was observed for triglyceride abnormalities (baseline: OR, 0.57; 95% CI, 0.26–1.27; p = 0.169; subsequent check-up: OR, 1.39; 95% CI, 0.69–2.82; p = 0.357). However, weight loss was significantly associated with improvement in both LDL-C (OR, 1.1; 95% CI, 1.09–1.14; p < 0.001) and triglyceride (OR, 1.16; 95% CI, 1.09–1.24; p < 0.001, Supplementary Fig. 4). Mean (range) VIF for this model was 1.35 (1.02–1.93), indicating that multicollinearity was unlikely to have affected the results.
Sensitivity analysis
A total of the 1771 participants with blood pressure abnormalities, 1121 with glucose metabolism abnormalities, and 3476 with lipid metabolism abnormalities were included in the sensitivity analysis, excluding individuals who were receiving relevant medications at the baseline check-up. Among these participants, 36.8% visited a medical institution after the baseline check-up for abnormal blood pressure, 44.3% for abnormal glucose metabolism, and 34.8% for abnormal lipid metabolism. The baseline characteristics are shown in Supplementary Table 1. The proportions of individuals whose abnormalities improved at the subsequent check-up were 58.3% for blood pressure, 36.8% for glucose metabolism, and 56.7% for lipid metabolism (Supplementary Fig. 5). Weight loss was consistently associated with improvement in blood pressure (OR, 1.09; 95% CI, 1.06–1.12), glucose metabolism (OR, 1.25; 95% CI, 1.20–1.30), and lipid metabolism (OR, 1.12; 95% CI, 1.10–1.15) at the subsequent check-up (all p < 0.001), and the use of corresponding medication at the subsequent check-up was also significantly associated with improvement in blood pressure (OR, 2.38; 95% CI, 1.84–3.08; p < 0.001) and lipid metabolism (OR, 22.73; 95% CI, 15.11–34.21; p < 0.001), respectively (Supplementary Fig. 6).