Would be really nice to have teams’ lines correspond to the team’s color. No way I was looking for the Flyers in purple. Very interesting representation though!
noodleofdata on
Lmao, Colorado encroaching into Chicago’s graph is hilarious
psumack on
Maybe I’m an idiot but how does it not immediately jump to at least +1 or -1 after the first game?
Are you just doing (goal differential)/82 for every point?

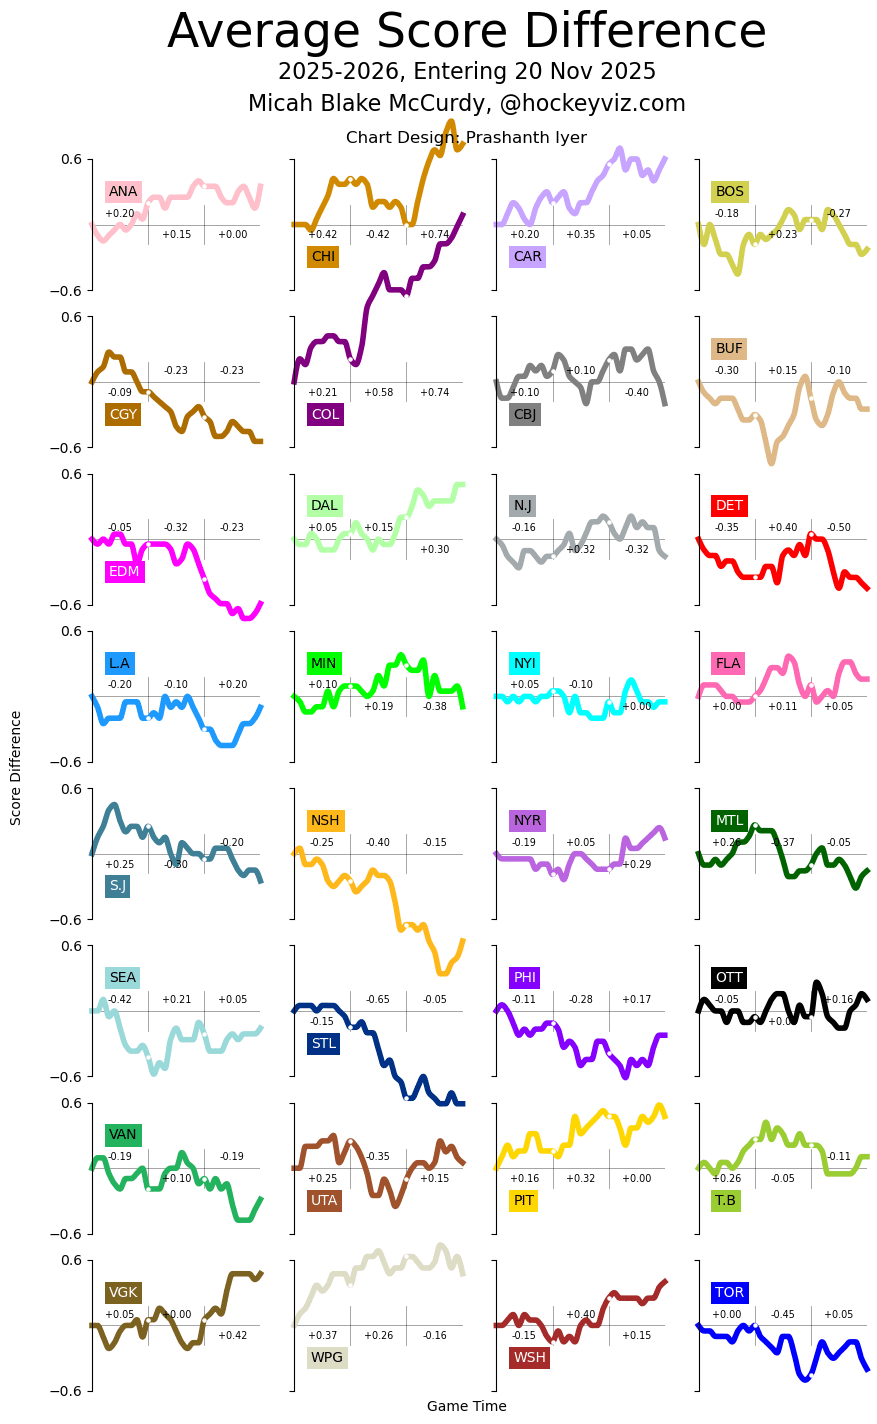
![[OC] Average score difference in the NHL so far this season.](https://www.byteseu.com/wp-content/uploads/2025/11/y17mokjevh2g1-631x1024.png "[OC] Average score difference in the NHL so far this season.")
3 Comments
Would be really nice to have teams’ lines correspond to the team’s color. No way I was looking for the Flyers in purple. Very interesting representation though!
Lmao, Colorado encroaching into Chicago’s graph is hilarious
Maybe I’m an idiot but how does it not immediately jump to at least +1 or -1 after the first game?
Are you just doing (goal differential)/82 for every point?