
![S&P 500 Shiller P/E Ratio Is Approaching Dot-Com Era Levels [oc]](https://www.byteseu.com/wp-content/uploads/2025/11/oxirycjtoo2g1-1536x768.png "S&P 500 Shiller P/E Ratio Is Approaching Dot-Com Era Levels [oc]")
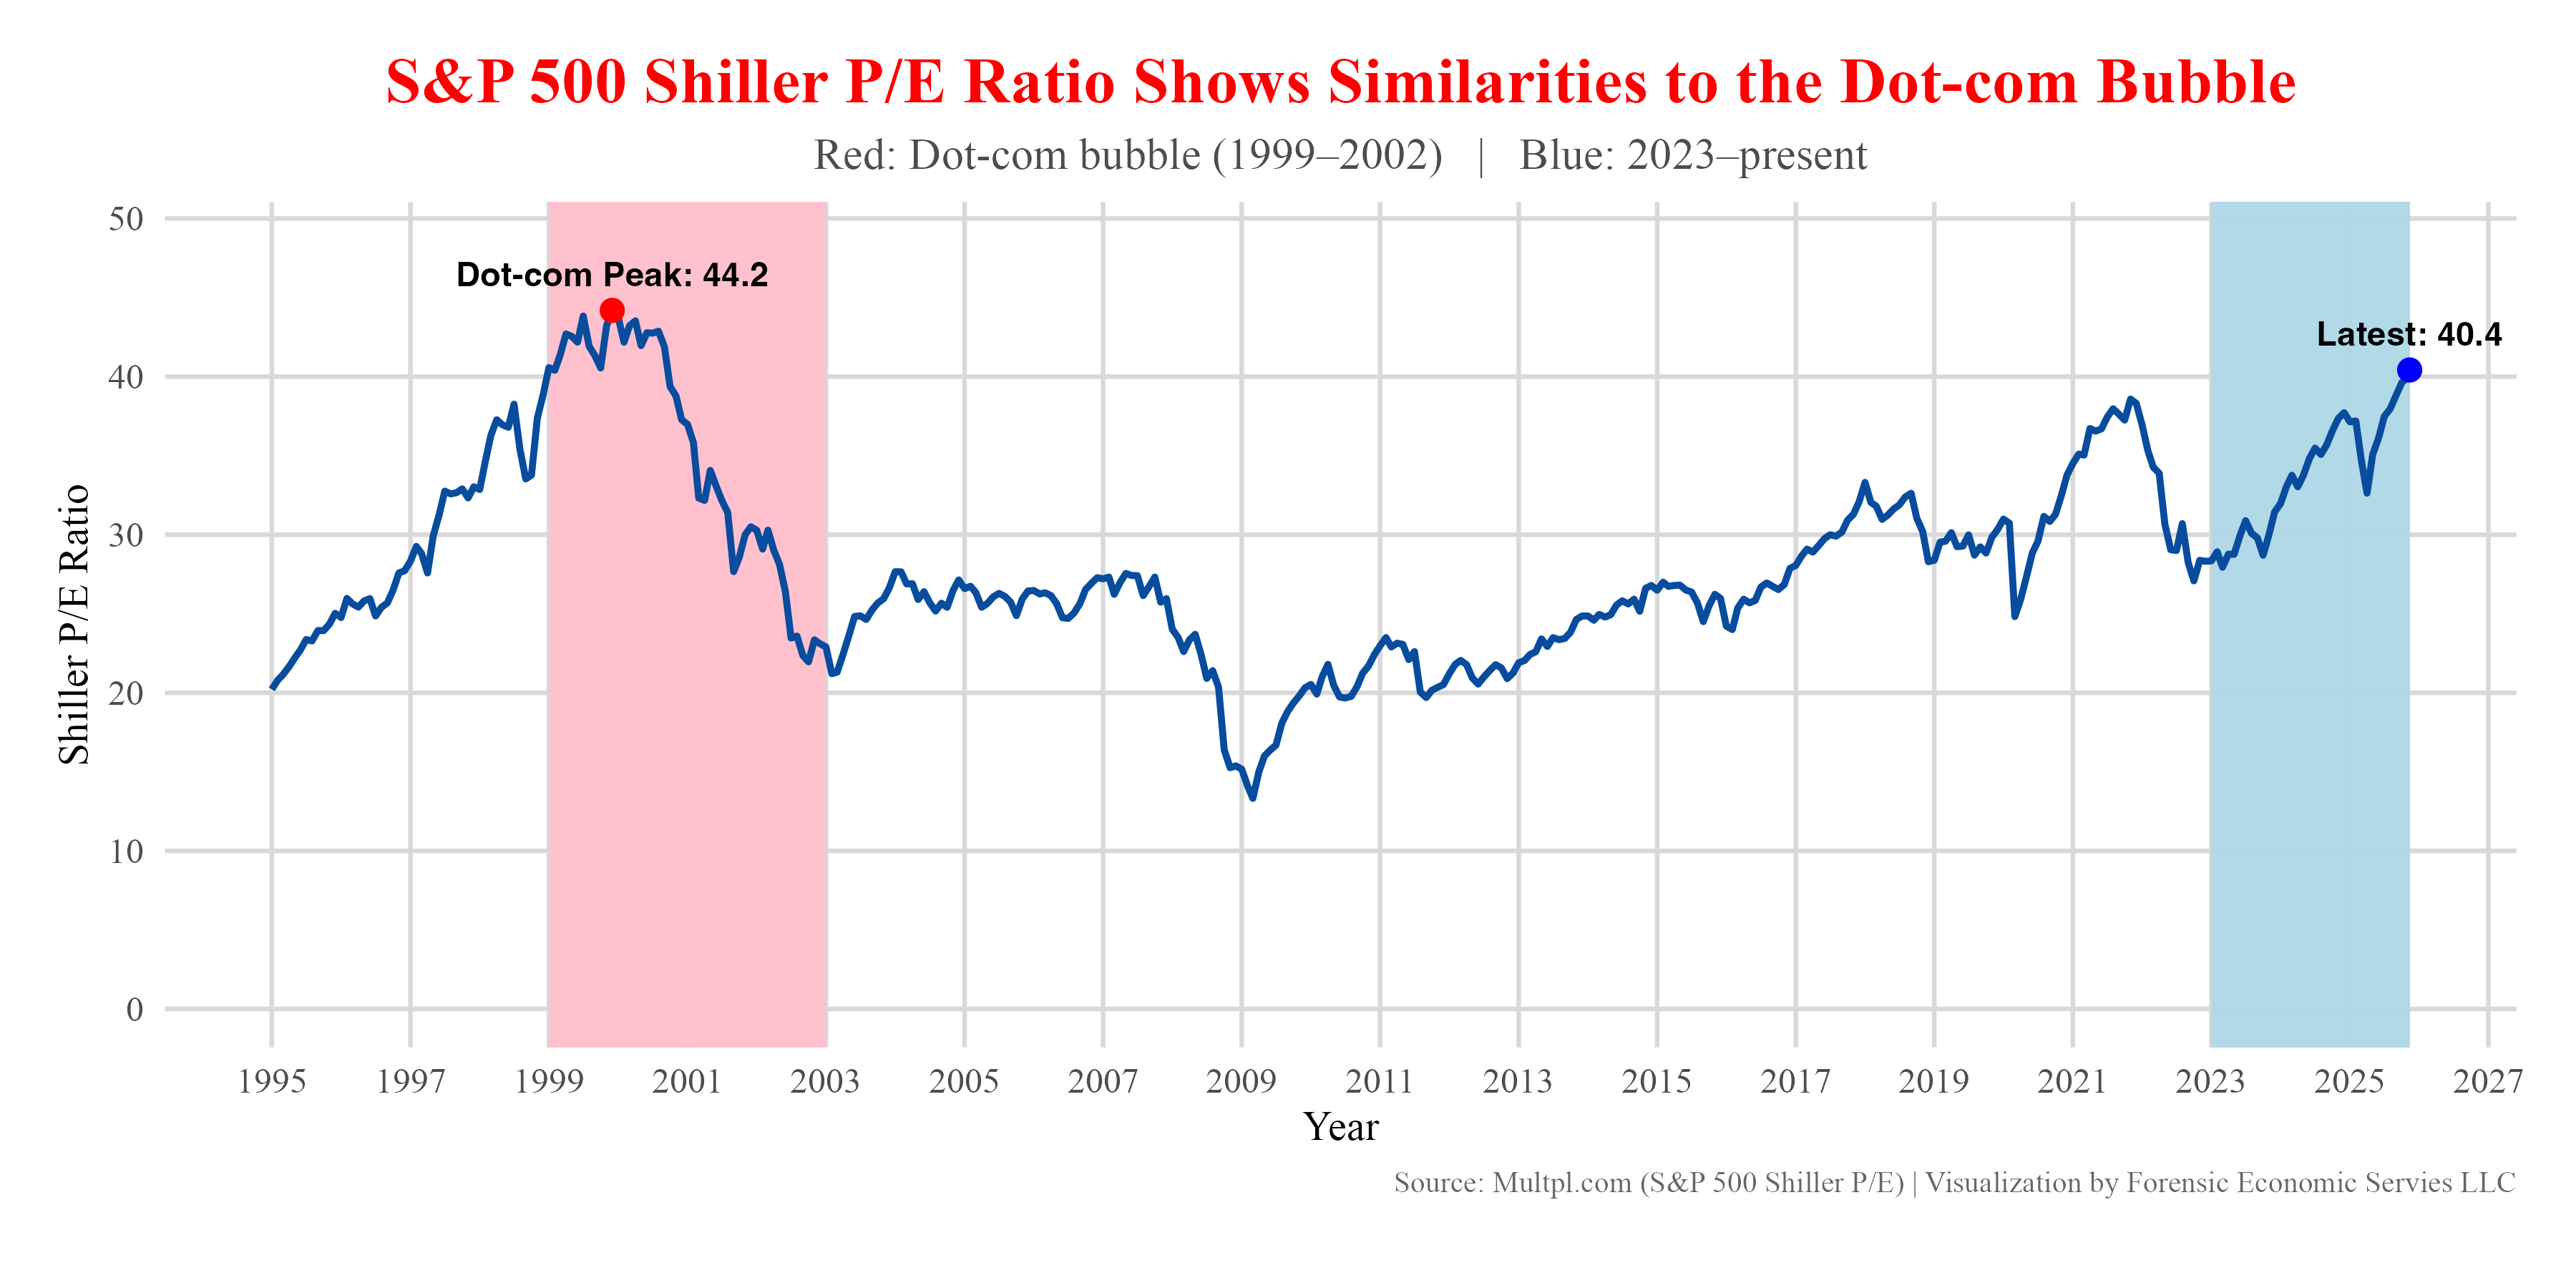
We examined the S&P 500 Shiller P/E ratio using data from Multpl.com and visualized the trend in R using ggplot2 to compare today’s valuations with past extremes.
Key takeaways:
- Dot-com bubble (1999–2002): Peak Shiller P/E of 44.2
- 2023–2025: Recent reading near 40.4, placing today’s valuation in historically elevated territory
- While today’s economic structure differs from the 1990s, the long-run context shows how rare it is for valuations to reach this zone
Data Source:
- Shiller P/E historical data from Multpl.com
- Visualization built in R (ggplot2)
- By Forensic Economic Services LLC (Rule703.com)
Posted by forensiceconomics
2 Comments
This one will be known in the future as the AI bubble
the market can stay irrational longer than you can stay solvent.