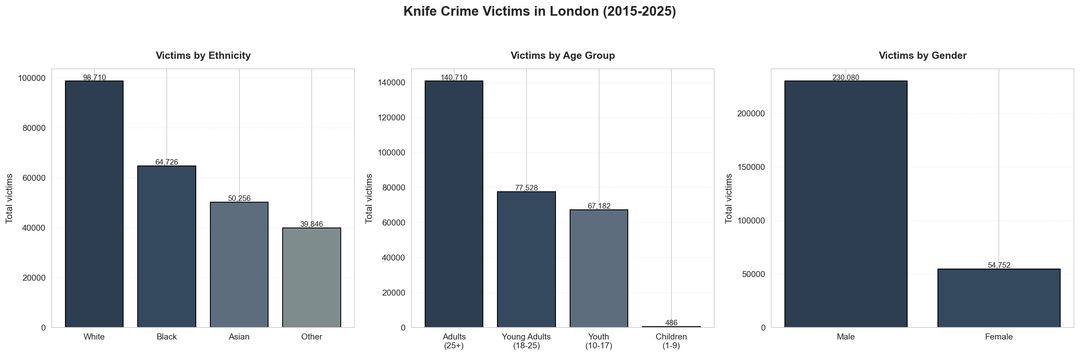
So according to that first image, middle chart… if we add up the totals of the bars, 140k, 60k and 80k, it means there have been 280k knife crime victims in London in a decade.
That averages at 76 victims a day.
That seems high. What constitutes a victim? Is being threatened by a knife wielding mugger a knife crime?
mr_pou on
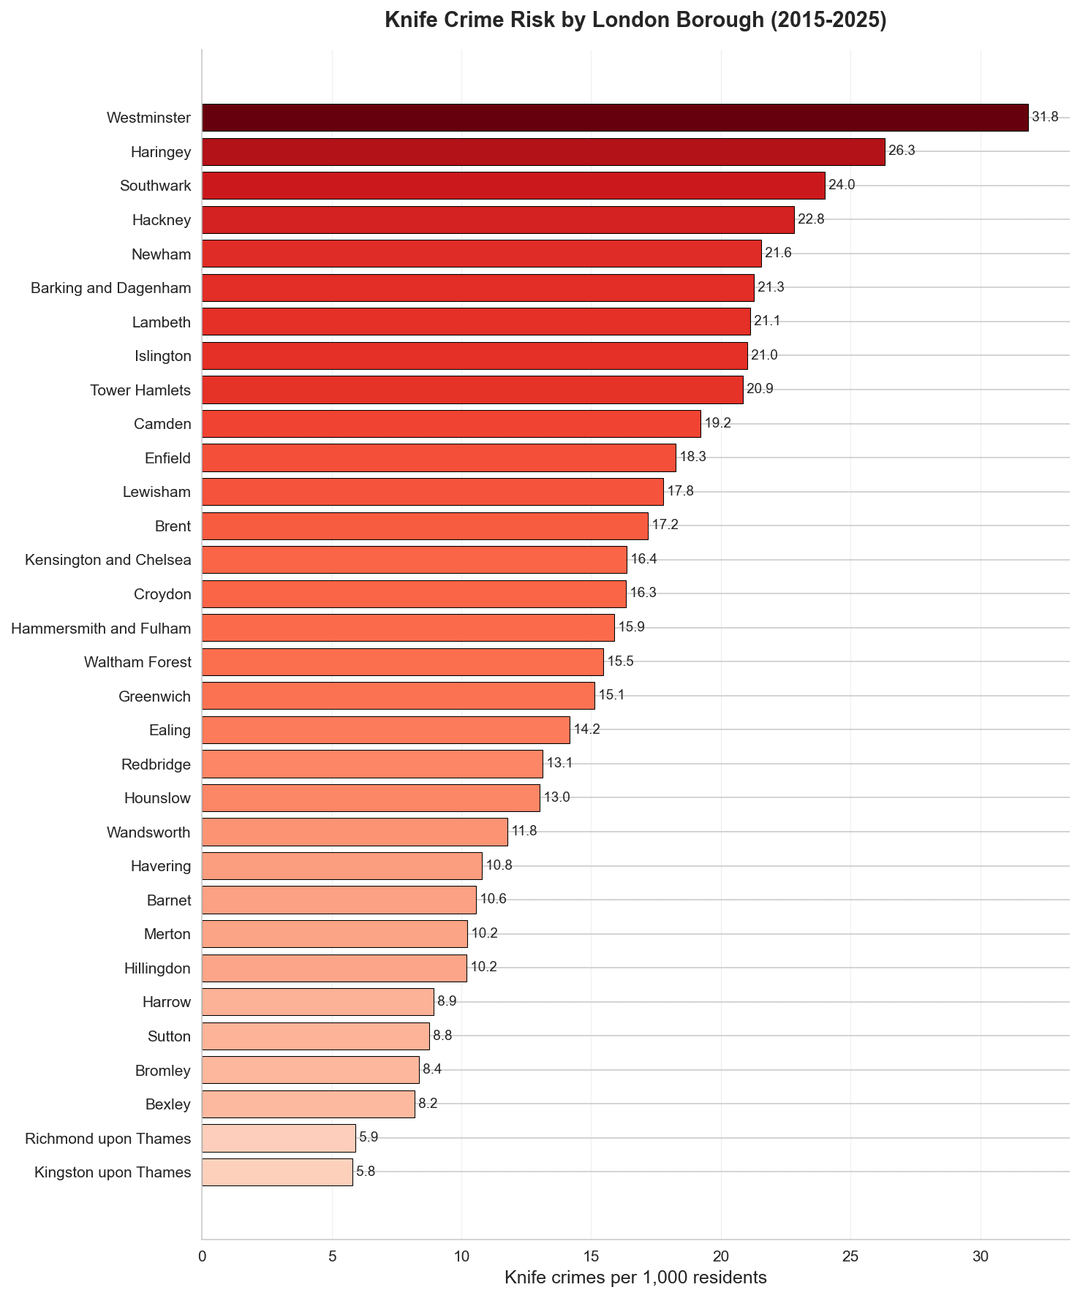
The ghetto that is *Westminster* 🤷🏻
stevied71 on
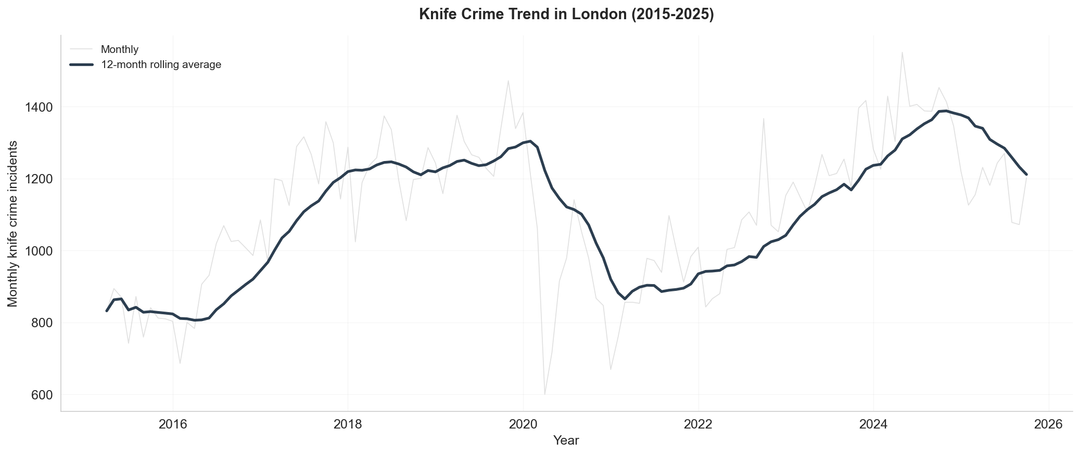
so trend over time is that, covid years excluded, it’s really the same as it ever was.
tanghan on
Wouldn’t statistics on the aggressors be more insightful than of the victims?
Usnoumed on
Can you take the data back 30 years?
badmancatcher on
Is Croydon so low because gun crime is more common? How is Hackney not top 3!? /s (kind of)
DrKurgan on
First pic would be better if showed the victims relative to the total population.
Also if 1-9 is very low and +25 is low compared to its population size. It’s possible most stabbings are 15-20 and 10-15 and 20-25 are low as well, but we don’t know with that chart.
LordByronsCup on
How wooooooo!
Knife crimes of London.🎶
Soluchyte on
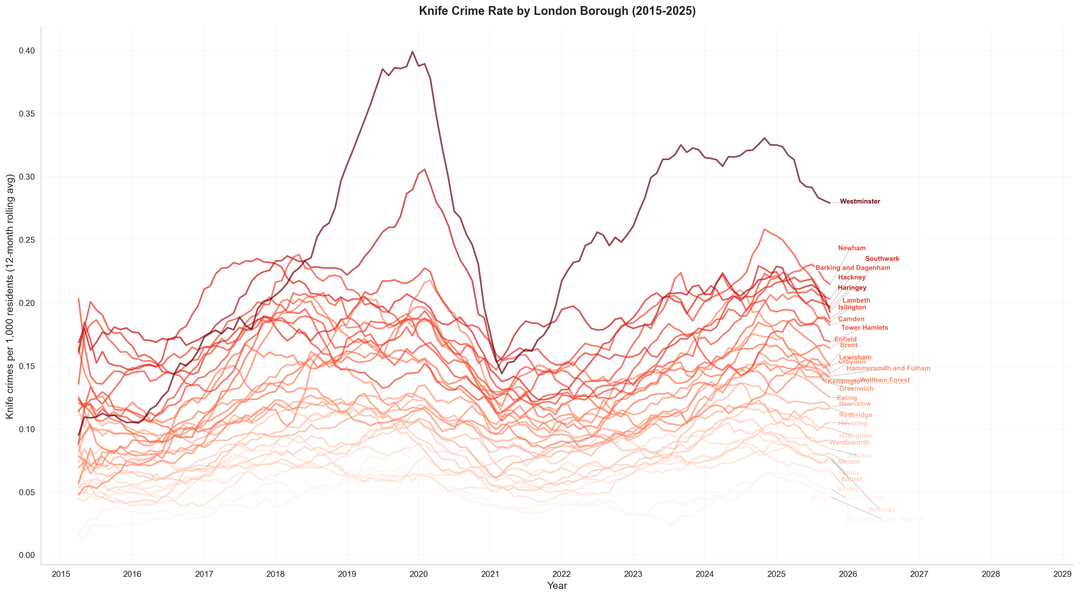
You can really see how big the difference between south west london is compared to basically everywhere else.
Pigsnot1 on
Can you account for population in the London graph? Considering London has over a million more people today than it had in 2015, the graph isn’t giving a great representation of the true incidence rate
tdfast on
How many deaths did these attacks cause?
babius321 on
The most interesting slide is not included
Tricksteer on
This seems a bit misleading. The names listed are racial categories not ethnicities. It would be interesting to see a similar graph but for actual ethnicities or nationalities.
MoreGaghPlease on
I’m not from England but a lot of those neighbourhood names sure look made up
Miserable_Corgi_764 on
Why is there no race for the criminals?
SoftwareArt on
would it make more sense to have the ethnicity normalized
say white victims/ total white pop to get the proportion rather than raw numbers
Dystopian_Reality on
Can we stop for a moment to acknowledge that 486 times a child in the age range of 1 to 9 years old has been a victim of a knife crime?
What the fuck is wrong with you if you pull a knife on a 9 year old?!
2ShotSx6ShotS on
Real brits get what they deserve.
FrostByteUK on
The most disgusting part of the statistics is the 486 (1-9) child victims… I’m assuming theres no data on whether the agressors related to these offenses were perpetrated by adults?
Clicky27 on
White men dominating another field… sigh
joelaw9 on
The first set of charts would be more useful as a percentage, as a ‘total’ they’re basically worthless.

![Knife crime in London 2015-2025 [OC]](https://www.byteseu.com/wp-content/uploads/2025/11/5llzoduunw2g1-1024x338.png "Knife crime in London 2015-2025 [OC]")
24 Comments
well looks like the next wave is coming to an end.. so that’s nice I guess. I didn’t know they fluctuate like ice ages.
Used Python / Matplotlib for plotting, sources are london met police data from [https://data.london.gov.uk/dataset/mps-monthly-crime-dashboard-data-e5n6w](https://data.london.gov.uk/dataset/mps-monthly-crime-dashboard-data-e5n6w) and ONS population to get per 1000 values [https://data.london.gov.uk/dataset/office-for-national-statistics-ons-population-estimates-borough–vd615/](https://data.london.gov.uk/dataset/office-for-national-statistics-ons-population-estimates-borough–vd615/)
So on average about 72,000 per year.
I’m no mathematician, but that sounds like a lot.
EDIT: Misread 2015 as 2021, my mistake
So according to that first image, middle chart… if we add up the totals of the bars, 140k, 60k and 80k, it means there have been 280k knife crime victims in London in a decade.
That averages at 76 victims a day.
That seems high. What constitutes a victim? Is being threatened by a knife wielding mugger a knife crime?
The ghetto that is *Westminster* 🤷🏻
so trend over time is that, covid years excluded, it’s really the same as it ever was.
Wouldn’t statistics on the aggressors be more insightful than of the victims?
Can you take the data back 30 years?
Is Croydon so low because gun crime is more common? How is Hackney not top 3!? /s (kind of)
First pic would be better if showed the victims relative to the total population.
Also if 1-9 is very low and +25 is low compared to its population size. It’s possible most stabbings are 15-20 and 10-15 and 20-25 are low as well, but we don’t know with that chart.
How wooooooo!
Knife crimes of London.🎶
You can really see how big the difference between south west london is compared to basically everywhere else.
Can you account for population in the London graph? Considering London has over a million more people today than it had in 2015, the graph isn’t giving a great representation of the true incidence rate
How many deaths did these attacks cause?
The most interesting slide is not included
This seems a bit misleading. The names listed are racial categories not ethnicities. It would be interesting to see a similar graph but for actual ethnicities or nationalities.
I’m not from England but a lot of those neighbourhood names sure look made up
Why is there no race for the criminals?
would it make more sense to have the ethnicity normalized
say white victims/ total white pop to get the proportion rather than raw numbers
Can we stop for a moment to acknowledge that 486 times a child in the age range of 1 to 9 years old has been a victim of a knife crime?
What the fuck is wrong with you if you pull a knife on a 9 year old?!
Real brits get what they deserve.
The most disgusting part of the statistics is the 486 (1-9) child victims… I’m assuming theres no data on whether the agressors related to these offenses were perpetrated by adults?
White men dominating another field… sigh
The first set of charts would be more useful as a percentage, as a ‘total’ they’re basically worthless.