
![[OC] What a Penny Doubled for 30 Days Actually Looks Like (The Exponential Curve Most People Underestimate)](https://www.byteseu.com/wp-content/uploads/2025/11/5x59ttgx344g1-683x1024.jpeg "[OC] What a Penny Doubled for 30 Days Actually Looks Like (The Exponential Curve Most People Underestimate)")
A classic thought experiment asks:
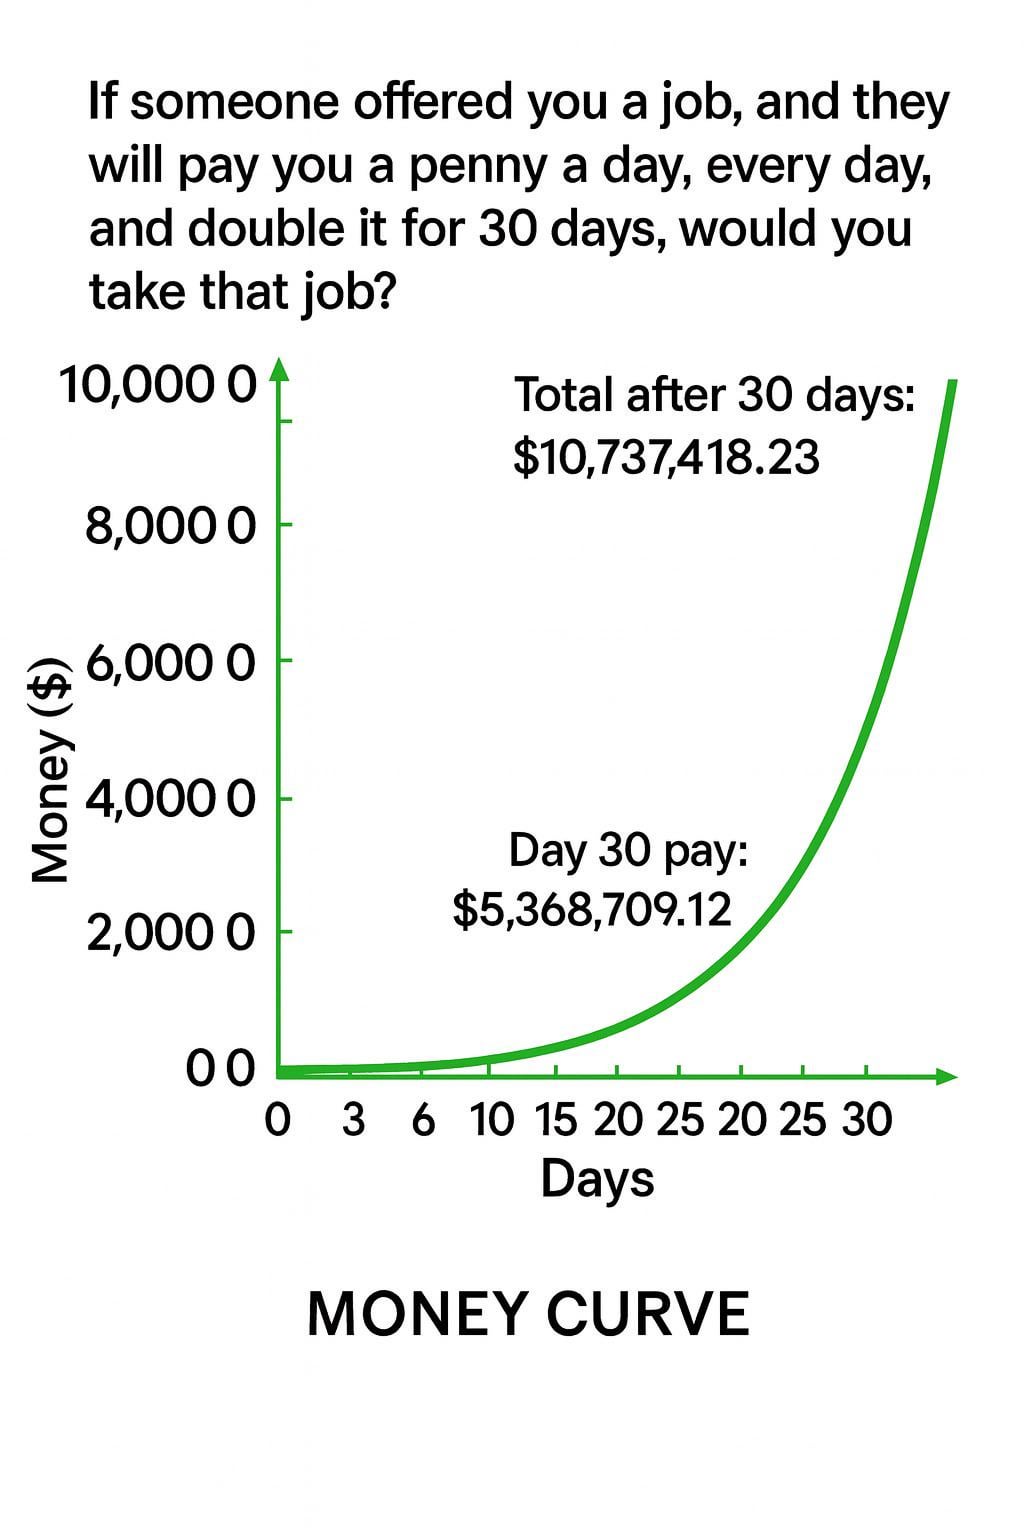
“If someone offered you a penny a day, doubled for 30 days, would you take it?”
Most people intuitively say no — because exponential growth is almost impossible to visualize.
Here’s the actual curve.
Day 1: $0.01
Day 10: $5.12
Day 20: $5,242.88
Day 30: $5,368,709.12 (single-day pay)
Total earned after 30 days: $10,737,418.23
What’s wild is how flat the curve looks for the first two-thirds of the month…
and then how violently it turns vertical near the end.
This is why exponential growth feels “unreal” to humans —
our brains are wired for linear change, not compounding.
Posted by tabularasa1130
9 Comments
If someone offered you a penny a day wouldn’t you have 30 cents at the end of 30 days?
This is data is beautiful not axis are ugly.
What blew my mind is how the exact same curve shows up whether you track dollars or just raw numbers.
We build entire systems around these exponential patterns, but most people only ever think linearly — which is why this question still surprises people.
If anyone wants the raw-number curve too (same math, just without the $), I can post it. It’s wild seeing how identical the shapes are.
If someone offered you a job.
* They pay a penny a day, every day.
* They then double the penny, every day.
So, as worded and simplified, you make two pennies a day, for 30 days.
The original teaser they’re referencing mentions specifically that you carry over the previous days amount – so the problem becomes, 2^30
What’s the job? Could I get fired if I’m not good at it?
Compound using the grain of rice and a chess board.
https://www.heartoftheart.org/?p=1230
Quick clarification for anyone confused about the setup:
The classic riddle is: “Start with $0.01 and double it every day for 30 days.”
So the pattern is:
Day 1 → $0.01
Day 2 → $0.02
Day 3 → $0.04
Day 4 → $0.08
…and so on.
Day-30 pay alone ≈ $5.37M, and the total over 30 days ≈ $10.74M.
The point of the graphic isn’t that anyone would actually offer this job — it’s to show how exponential growth looks flat for a long time and then suddenly goes almost vertical at the end. Our brains are bad at intuitively seeing that curve.
[Relevant SMBC](https://smbc-comics.com/index.php?id=4071)
I understand what you are trying to illustrate, but I don’t know how to interpret the portion of the y-axis between 0 and 2,000.