
![Ecological calendar I can generate for anywhere in the continental U.S. [OC]](https://www.byteseu.com/wp-content/uploads/2025/12/i2nl0xdwq25g1-1157x1536.jpeg "Ecological calendar I can generate for anywhere in the continental U.S. [OC]")
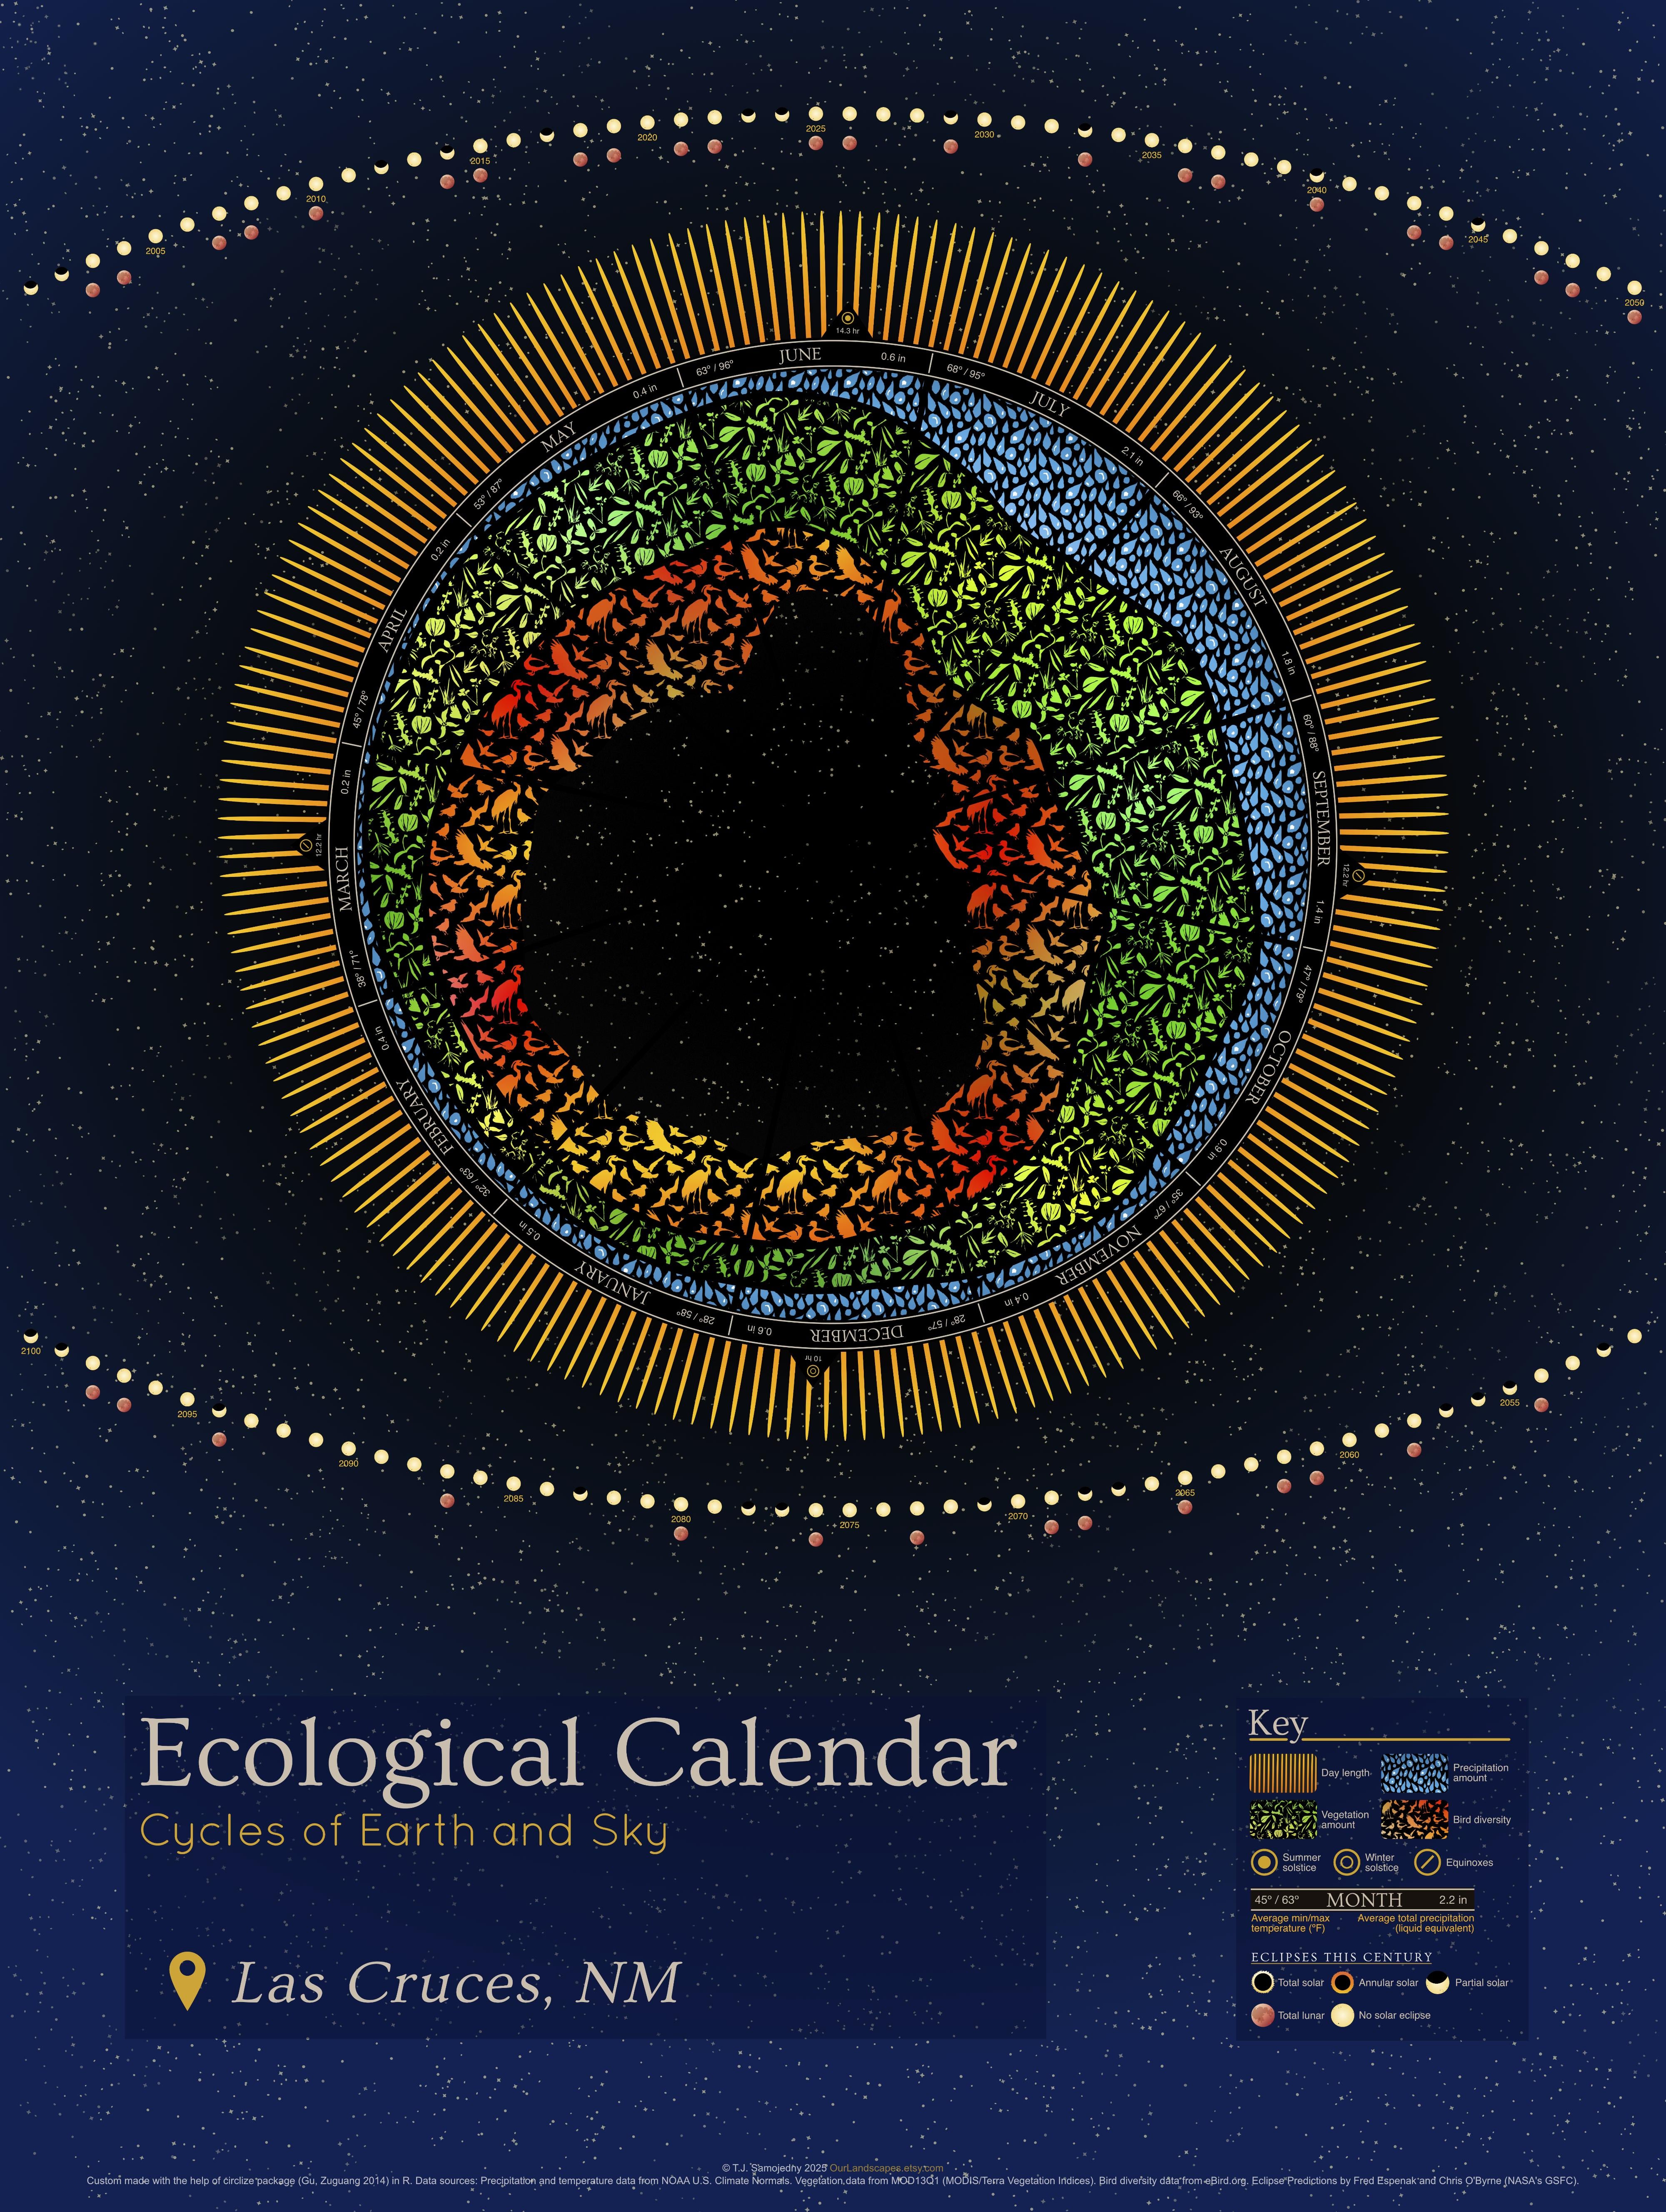
I wanted to make an ecological calendar, with data for eclipses, day length, precipitation, vegetation amount, and bird diversity plotted over the course of a year. And with code I wrote in R, I am able to generate a graphic like this for anywhere in the contiguous US! Both the inner rings and the outer eclipse bands were made using the help of the circlize package, which does some really cool circular plotting. If anyone wants to see what it looks like for other locations, check out my Etsy.
Posted by landschaften
4 Comments
Date sources:
– Didan K (2021). MODIS/Terra Vegetation Indices 16-Day L3 Global 0.05Deg CMG V061. NASA Land Processes Distributed Active Archive Center. [https://doi.org/10.5067/MODIS/MOD13C1.061](https://doi.org/10.5067/MODIS/MOD13C1.061) Date Accessed: 2025-07-11
– eBird (2021). eBird: An online database of bird distribution and abundance. eBird, Cornell Lab of Ornithology, Ithaca, New York. http://www.ebird.org.
– Espenak F, O’Byrne C (2010). Eclipse Predictions. NASA Eclipse Web Site. [https://eclipse.gsfc.nasa.gov/eclipse.html](https://eclipse.gsfc.nasa.gov/eclipse.html)
– Jared RJ, Durre I, Palecki MA (2022). U.S. Daily Gridded Precipitation and Temperature Climate Normals for 1991-2020. NOAA National Centers for Environmental Information. https://www.ncei.noaa.gov/products/land-based-station/us-climate-normals.
– Jared RJ, Durre I, Palecki MA (2022). U.S. Monthly Gridded Precipitation and Temperature Climate Normals for 1991-2020. NOAA National Centers for Environmental Information. https://www.ncei.noaa.gov/products/land-based-station/us-climate-normals.
Programming tools:
– Gu Z (2014). circlize implements and enhances circular visualization in R. Bioinformatics. Hijmans R (2024). _geosphere: Spherical Trigonometry_. doi:10.32614/CRAN.package.geosphere <https://doi.org/10.32614/CRAN.package.geosphere>, R package version 1.5-20, <https://CRAN.R-project.org/package=geosphere>.
– Johnson M (2025). _climateR: climateR_. R package version 0.3.7, commit 718a8d0357e9249894fb4f6e922911042db47e79, <https://github.com/mikejohnson51/climateR>.
– R Core Team (2025). _R: A Language and Environment for Statistical Computing_. R Foundation for Statistical Computing, Vienna, Austria.<https://www.R-project.org/>.
– Van Laake P (2025). _ncdfCF: Easy Access to NetCDF Files with CF Metadata Conventions_. R package version 0.5.0.9000, commit 7e40d2c7ac20cb527c54a04e2c76a7cbef60a374 <https://github.com/pvanlaake/ncdfCF>.
Inspriation: [https://cyclesofgaia.com/](https://cyclesofgaia.com/)
Looks neat, would make a cool poster! Couple questions:
1) Is there a reason you focused on bird diversity specifically, or just because it has the most data?
2) Does the gradient coloring for the bird diversity mean anything (orange to red) or is that just an aesthetic choice?
3) Do you happen to live in New Mexico? Las Cruces is not a place you see mentioned online much.
This would be a great way to visualise the changes climate change is having on different species over time.
Great work. If you do one for Ireland, let me know
This is insanely cool. Like early 2010s app inventor or ancient forest wizard levels of cool!
On top of compiling a lot of mismatched data and making a full on months-worth-of-work tool for letting people find theirs, you made it PRETTY 🤯 👏
That thing could literally sell as an art piece.