
![[OC] Heatmap generated from a multiscale transform of my experimental data](https://www.byteseu.com/wp-content/uploads/2025/12/qv4ither495g1-1024x569.png "[OC] Heatmap generated from a multiscale transform of my experimental data")
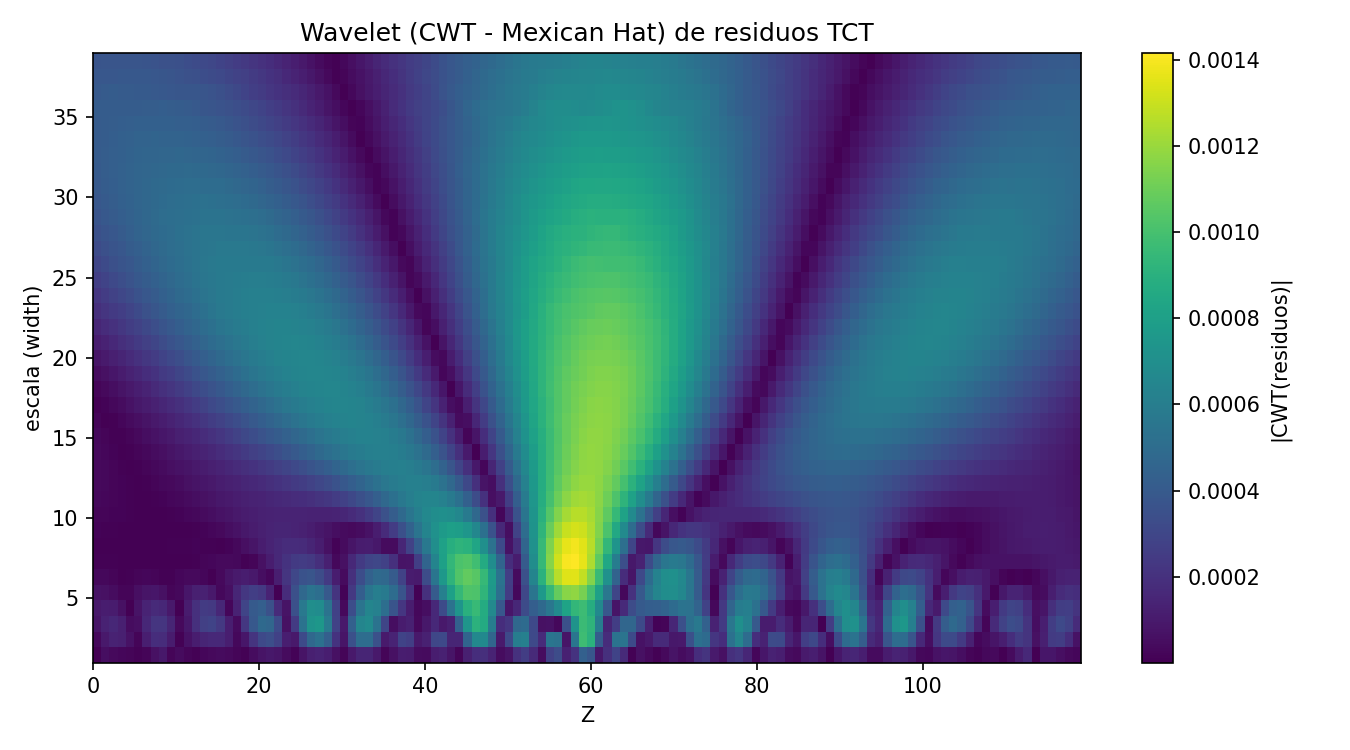
Data source: Public dataset from a nonlinear triple-slit experiment published on Zenodo (DOI: https://doi.org/10.5281/zenodo.17821869
Tools used: Python (NumPy, SciPy, PyWavelets, Matplotlib).
This visualization shows the Continuous Wavelet Transform (Mexican Hat) applied to the residual signal obtained after modeling the experiment.
Different scales highlight periodic structures and environmental patterns hidden in the raw data.
Posted by SubstantialFreedom75
2 Comments
It looks cool, but what does it mean? A pretty plot is great, but what is the story here?
And no, I’m not going to read the paper to find out.
Need a description of the experiment/physical system here (more than just triple slit optical). Text here and in the link focuses too narrowly on processing jargon.