So based on this graph, I guess everyone is getting it on in the winter.
tomrichards8464 on
Would be interesting to see how the pattern changes over time as the balance of births shifts between different regions. I assume the early years in the sample are heavily led by China, middle years by India and most recent years by Africa.
eskimospy212 on
I think February having around 9% fewer days than the average month is considerably affecting the results.
howardcord on
The data should take into account the number of days in each month. Feb would instead be ~3.08M per day while Dec would be the lowest at 2.95M per day. Sep would still be the highest at 3.28M per day.
This would average out some of the cyclic data we see from Jan to Aug.
Jeoshua on
You know, I bet the trends would be even greater if you skewed the Southern Hemisphere entries 6 months out of phase with the Northern ones.
SokuTaIke on
Does this take into account the regions where they don’t really keep track of the birthday? A lot of those winter babies get a jan 1st on their registration. I wonder if that causes the spike in jan and the drop in feb?
Chronicallybored on
I’ve looked at this data before and the coverage is not as complete as one would like. Mainland China and India don’t release any data on monthly births to the UN, so neither of those countries would be represented in this data. Here’s the source the AI is probably using: [https://data.un.org/Data.aspx?d=POP&f=tableCode%3A55](https://data.un.org/Data.aspx?d=POP&f=tableCode%3A55)
owleaf on
September tracks. Everywhere I’ve ever worked, the bulk of the birthdays happen in July-September.
AntiDECA on
Huh, I didn’t think June would be so low. Wonder why
HiFiGuy197 on
Back on November 16 I was at an IHOP and they sang Happy Birthday to about half a dozen people.
I guess a lot of folks had a memorable Valentine’s Day.
Loki-L on
Instead of births per month and connecting the dots, it should probably use something like births per day and a 30 day running average of births per day.
just dividing the year into 12 unequal parts probably isn’t a good idea.
Of course the data may not be there from everywhere.
Also it might be a good idea to separate this into Northern and Southern Hemisphere with maybe equatorisl countries in their own category.

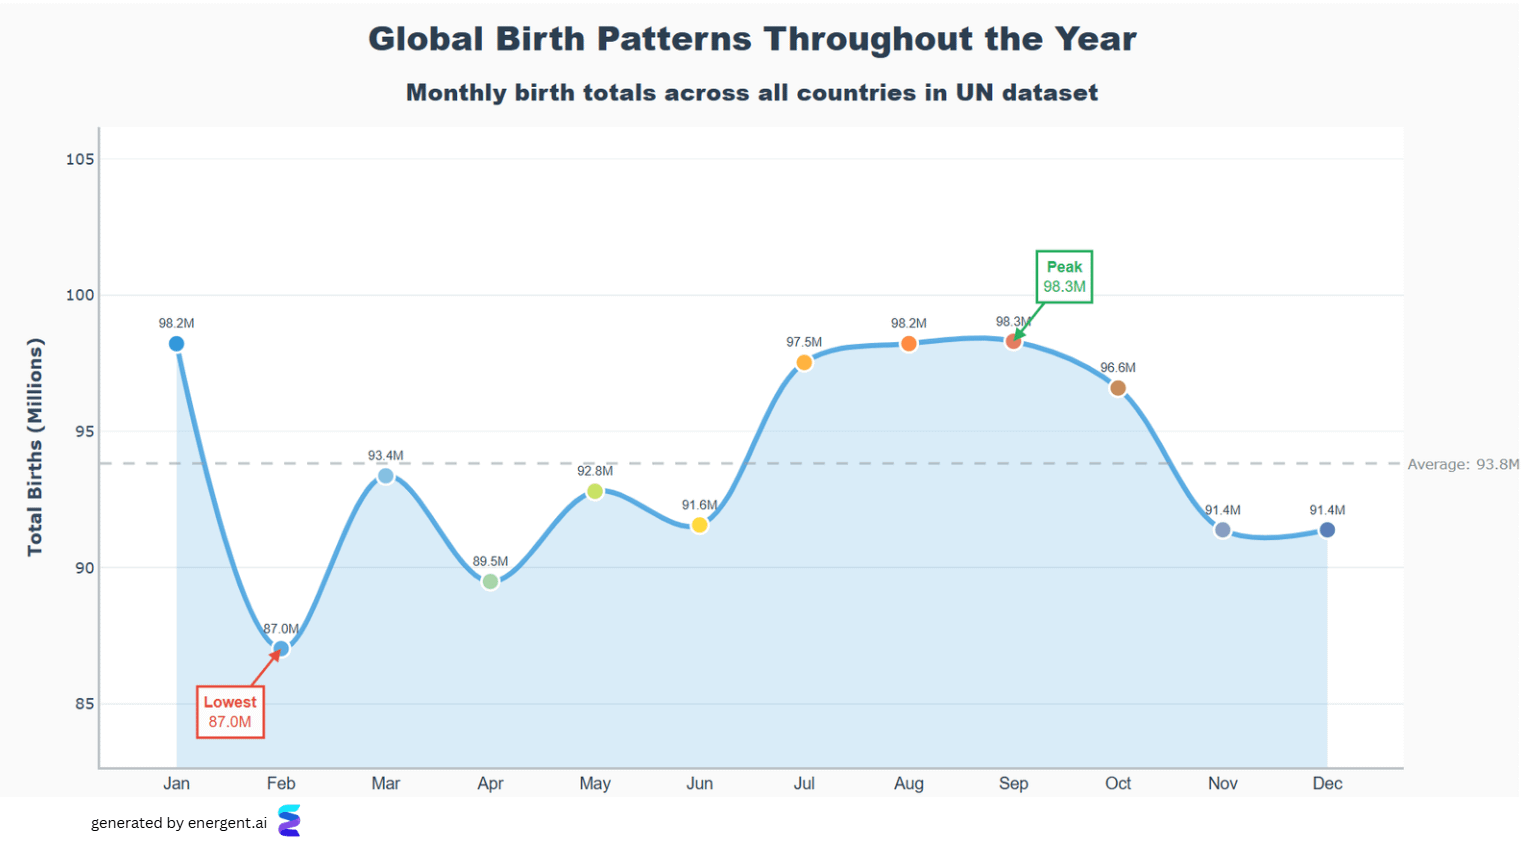
![[OC] Global Monthly Birth Patterns from 1967 - 2025](https://www.byteseu.com/wp-content/uploads/2025/12/1d8cto55376g1-1024x564.png "[OC] Global Monthly Birth Patterns from 1967 – 2025")
12 Comments
Data source: [UNdata](https://data.un.org/Data.aspx?d=POP&f=tableCode%3A55)
Tool used: [Energent.AI](http://Energent.AI)
So based on this graph, I guess everyone is getting it on in the winter.
Would be interesting to see how the pattern changes over time as the balance of births shifts between different regions. I assume the early years in the sample are heavily led by China, middle years by India and most recent years by Africa.
I think February having around 9% fewer days than the average month is considerably affecting the results.
The data should take into account the number of days in each month. Feb would instead be ~3.08M per day while Dec would be the lowest at 2.95M per day. Sep would still be the highest at 3.28M per day.
This would average out some of the cyclic data we see from Jan to Aug.
You know, I bet the trends would be even greater if you skewed the Southern Hemisphere entries 6 months out of phase with the Northern ones.
Does this take into account the regions where they don’t really keep track of the birthday? A lot of those winter babies get a jan 1st on their registration. I wonder if that causes the spike in jan and the drop in feb?
I’ve looked at this data before and the coverage is not as complete as one would like. Mainland China and India don’t release any data on monthly births to the UN, so neither of those countries would be represented in this data. Here’s the source the AI is probably using: [https://data.un.org/Data.aspx?d=POP&f=tableCode%3A55](https://data.un.org/Data.aspx?d=POP&f=tableCode%3A55)
September tracks. Everywhere I’ve ever worked, the bulk of the birthdays happen in July-September.
Huh, I didn’t think June would be so low. Wonder why
Back on November 16 I was at an IHOP and they sang Happy Birthday to about half a dozen people.
I guess a lot of folks had a memorable Valentine’s Day.
Instead of births per month and connecting the dots, it should probably use something like births per day and a 30 day running average of births per day.
just dividing the year into 12 unequal parts probably isn’t a good idea.
Of course the data may not be there from everywhere.
Also it might be a good idea to separate this into Northern and Southern Hemisphere with maybe equatorisl countries in their own category.