
![[OC] Counties Where More People Are Uninsured Have Double the Medical Debt](https://www.byteseu.com/wp-content/uploads/2025/12/1n1zi8shme6g1-1024x683.png "[OC] Counties Where More People Are Uninsured Have Double the Medical Debt")
Source: Urban Institute Debt and Census
Tool: R
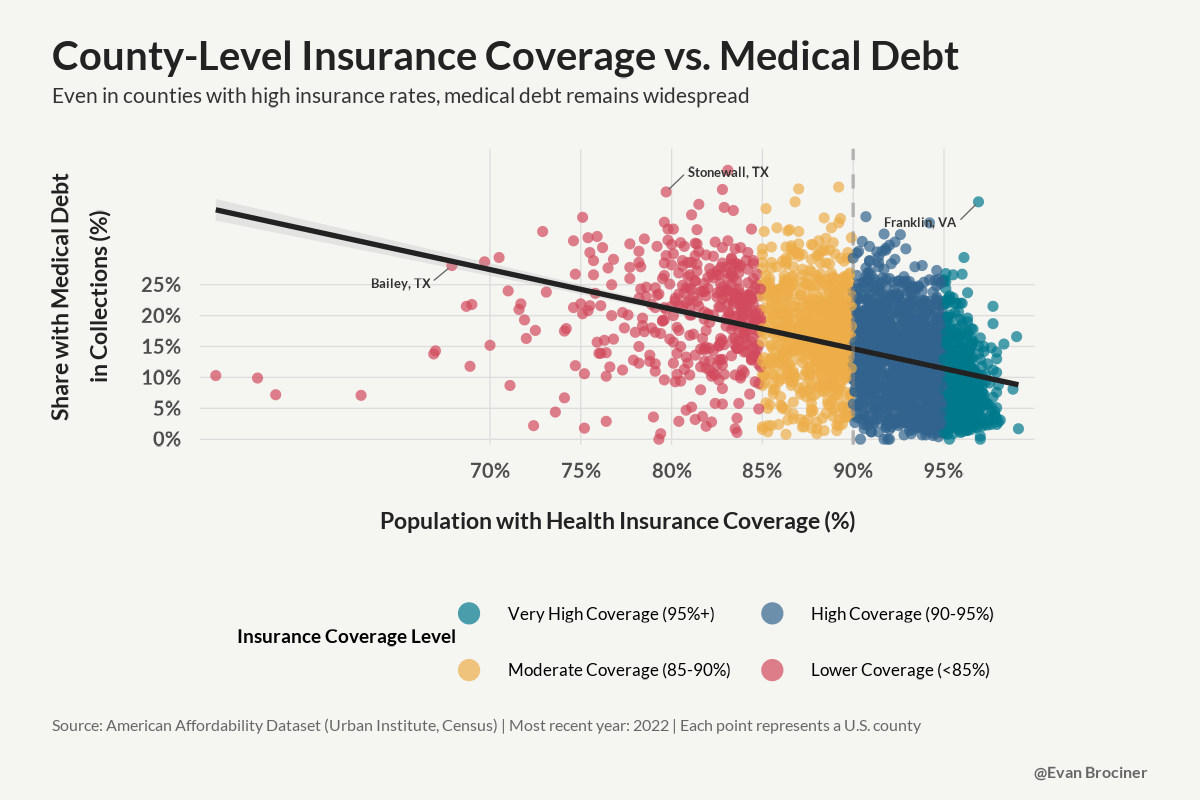
I analyzed 3,076 counties (2022):
– Very High Coverage (95%+ insured): 9.3% average with medical debt
– High Coverage (90-95%): 13% average with medical debt
– Moderate Coverage (85-90%): 17.1% average with medical debt
– Lower Coverage (<85%): 20.1% average with medical debt
Strong correlation (-0.421, p<0.001).
Cuts to Medicaid and ACA premium increases could push 16M more Americans off coverage. 100 million people—41% of adults—already owe medical debt.
Imagine where you can go to the doctor or the hospital and not have worry about going bankrupt, and only focus on your health.
Posted by evanbrociner
3 Comments
Another way to look at this is that even at the highest coverage levels, there’s still a sizeable portion of people who have excessive medical debt despite that coverage.
Am I reading this right that even with insurance, roughly 15% of people can’t afford their medical bills before financing, on a national level?
I’m confused. The Y-Axis says “medical debt in collections” suggesting that this is past due, but then your explanation only mentions medial debt. Which is it?
For example, someone could have medical debt to pay off a surgery over time, but that debt wouldn’t be in collections if it’s paid regularly.