
![[OC] The housing potential of surface parking in NYC](https://www.byteseu.com/wp-content/uploads/2025/12/jngbq1v38t6g1-1536x807.png "[OC] The housing potential of surface parking in NYC")
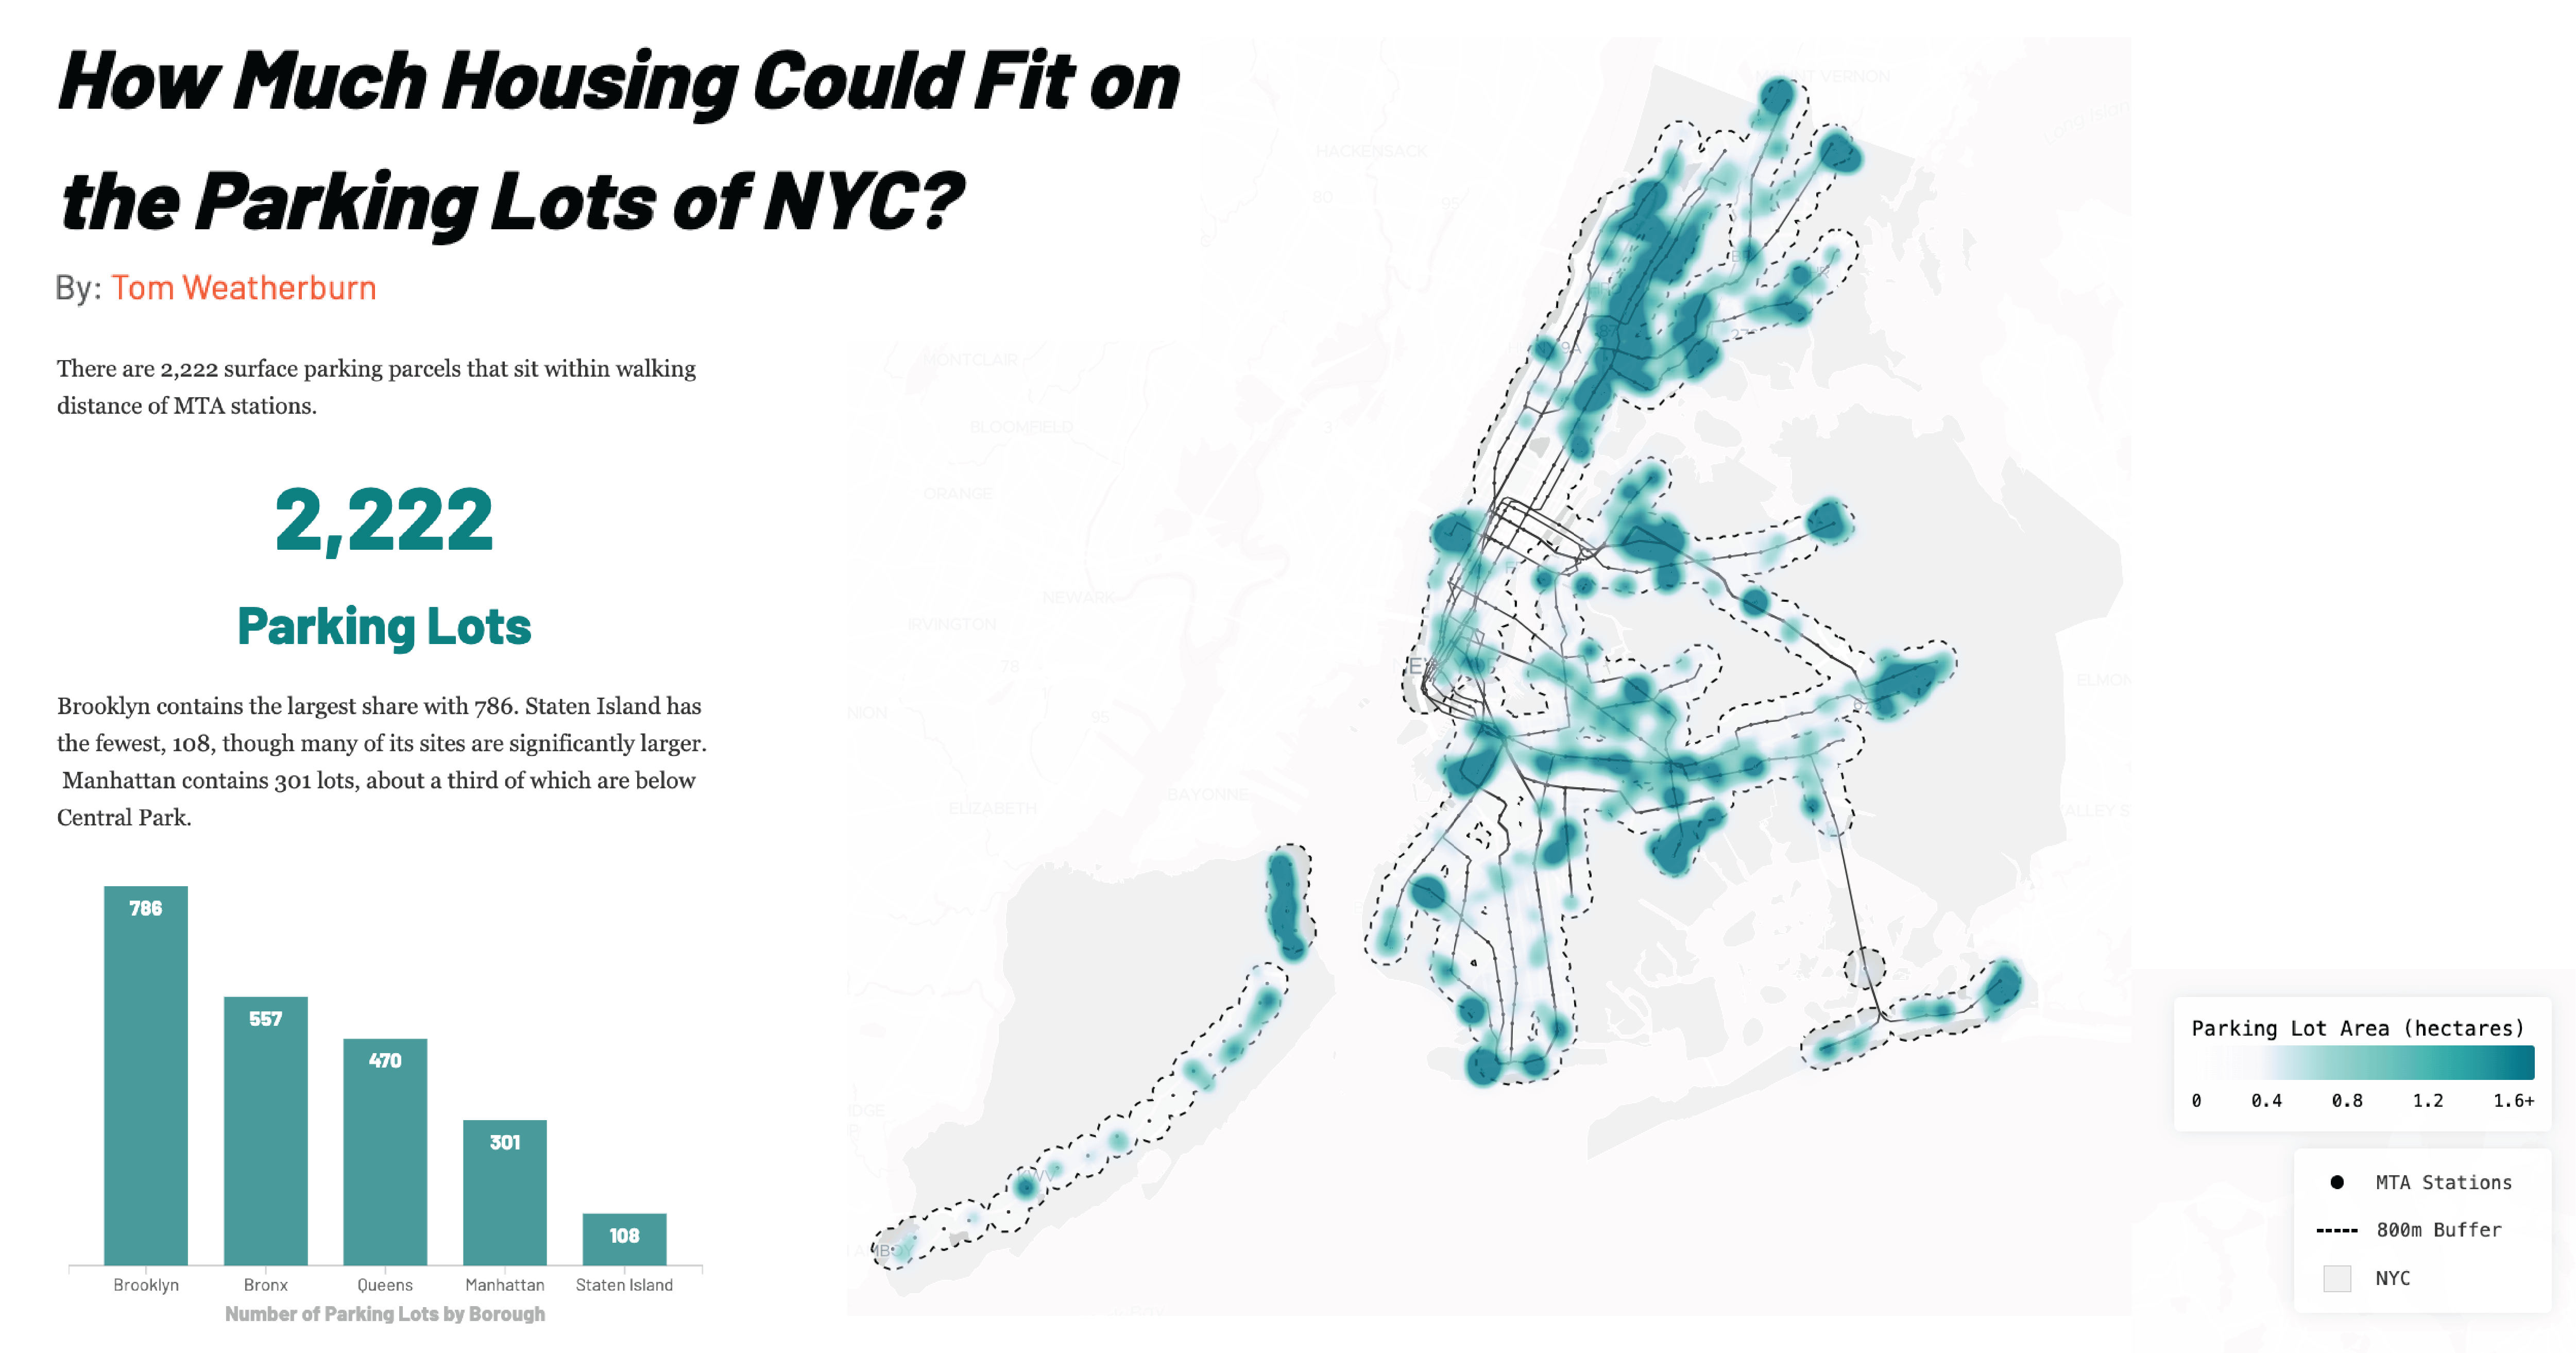
I created an FAQ style story map using SvelteJS, D3 and mapLibre. Used PLUTO data to identify surface lots and the density of recent housing development. Combining the two gave me an estimae of the total housing potential.
Have a look here: https://tdubolyou.github.io/nyc-lots/
Would be grateful for any feedback! Working on a few more like this.
Posted by tdubolyou
5 Comments
I’ve often thought it’s insane how much of the most valuable land in the US is dedicated to surface parking.
you should have conveted these to units of housing based on the density of housing at the location. shouldn’t be too hard in qgis or even just with geopandas .
Do you have the points dataset (maybe a geojson?) on your github? i’d love to play around with the data
That’s actually shockingly little. A quick google has NYC having like 3.5 million housing units. That’s like… a 2% increase.
How many housing units when you include 2 parking spaces for each one?
1/2 😉
why do you need to use absurd units like hectares? It can’t be for Americans because it’s a metric-based unit and everyone else would just rather you use square meters. Nobody buys an apartment by the hectare.
Also, am I misreading or is this only counting a minority of parking lots while being titled “how much housing could fit on the parking lots of NYC?” If so, this is actually *incredibly* deceptive. If not, you really need to rephrase.