The 59% of 45-54 year olds with less than $50,000 saved for retirement are ngmi
lsp2005 on
Why exclude data for sample size concerns when there is no identifying information included in this chart?
GilbyGlibber on
Someone needs to make a PSA for /r/personalfinance
jeesuscheesus on
Makes sense that younger people have less savings, but it would be interesting to see each generations savings at a specific age.
cpt_cat on
This is a scary graphic…I don’t feel like I am adequately prepared for retirement and i’m in the top 20% for my age group…
ykliu on
Quite surprised how large the $0 is.
04221970 on
This looks suspiciously incorrect.
53% if 65+ have saved $0 for retirement. I’d like to know the definitions of some words and the methodology for determining this.
InevitablePresent917 on
Maybe I’m not understanding this graph, but does the Boomer+ demo having the largest $0 proportion mean that, right now, half of that cohort have exhausted whatever savings they might have had, or does it mean they never had the savings? If the former, I’m not sure this graph is particularly helpful.
jonny_walkman on
The older group had pensions. I doubt those are looked at the same as 401ks or IRAs and might explain some of the gap there.
HarlequinKOTF on
And this is why welfare exists! No one should be going hungry or cold, especially those who can’t work anymore.
Whoa_PassTheSauce on
Half under 35 at 0 is fucking crazy. I’m behind by traditional advice but the top 5% in the age group. Only possible given my high income (lady luck smiled on me half a decade ago). Even if a significant portion forgoed retirement savings to buy a house now, that is a hell of a bet on real estate value.
I mean, this seems like a catastrophe waiting in the deep.
Confident-Mix1243 on
I’d like to see this as a life table, corrected for age.
Of course young people, who have more earning time and more compound-interest time ahead of them, “should” have less saved than old ones. But how were today’s 50-yos doing when they were 20?
turb0_encapsulator on
They took out some wealthier households because of sample size concerns? that seems a bit like putting your thumb on the scale.
also, I think looking at only retirement accounts is a bit misleading since there are plenty of people who have tons of home equity value who will likely sell and move somewhere smaller and cheaper when they retire.
(I believe the decline in home values that we are seeing is going to be the thing that indirectly causes a deep recession. even if most people have low mortgage payments, they are going to cut back on spending if the see the value of their home decline and know that they need to start saving more for retirement. there will be a cascade effect from lowering home prices.)
Rootfour on
The report calls out it does not include DB pension which was standard until like 20 years ago. So older age groups should all increase while little effect on youngest age group.
Edit: Also not included are home equity, investment accounts or even checking accounts. The data only includes IRA and DC plans. Only calling out DB as it is also a main source of retirement income.
Mukarsis on
I know shit’s fucked, but that 0 range seems incredibly high.
cgibsong002 on
Is this per household or individual? And I feel like the sample size must be absolute garbage if under 35 with >250K doesn’t even make the chart.
makemeking706 on
Thumbnail looks like Brazil.
thisisclassicus on
This doesn’t include 401k ? Just Ira?
miniscant on
The method is still unclear. Suppose a married couple have individual IRA accounts with one four times the amount in the other’s. Did they get averaged? Counted as one having above a million and the other less than 100K? It could misrepresent the household numbers.
StickFigureFan on
Those over 65 actually are less likely to have more than a million in savings than those 60 years old?
I think we might need to break 65+ into multiple brackets:
65-74, 75-84, 85+
I’m curious if the retirees have spent down their savings money or if they never had it to begin with
The big caveat here is, this only counts DC (like 401k) and IRA account. Many household have defined benefit (DB) pensions plan instead (teacher, police unions, some large automotive companies etc. [About 12% of 65+ retirees aged 65+ received 90%](https://www.census.gov/library/working-papers/2017/demo/SEHSD-WP2017-39.html) or more of their income from Social Security. So the true ‘none’ is closer to 10% and not 53%.
calodero on
Half of Americans over 65 have 0 savings. Thats frightening and sad
FuriousFrenchman on
Imho not so uncommon. People inherit from their parents. The young generation’s wealth is not theirs yet but their parents.
no_sight on
Compound interest is a hell of a drug. Current retirement age is 67. People become adults at 18.
$150 a month for 49 years is $1,200,000 at 9% returns.
professcorporate on
Problem with ‘data’ like this is that it’s just flat up not representing what the title describes. While if you look in the small print, 46% of people overall may indeed _not have a defined contribution or Individual Retirement Account_, vast numbers of that 46% will have balances, some quite substantial some less so, that will serve them in retirement, simply held in other vehicles such as markets, ordinary savings accounts, other assets of varying liquidity, etc.
data_makes_me_happy on
How can this be true? On social media/reddit alone I see Millennials and Gen Z talking about their $500k+ portfolios left and right.
scruffigan on
I wonder if this is asking individuals for their retirement net worth versus surveying account balances from the investment brokerage side.
Because I, like many, have accounts with more than one investment companies (one with Vanguard, one with Fidelity, and one with TIAA). The sum of these is in a different bracket than any one considered alone.
HegemonNYC on
Only counting assets in retirement accounts or pensions, I’d say this is missing a huge amount of higher earner wealth. Most folks working in tech or finance often have most wealth in RSU and ESPPs, and these are fully outside 401k or will exceed annual pre-tax limits.
Oh, and also doesn’t count the value defined payment pensions, which are semi-common for older people. Really, this isn’t that valuable without these major sources of retirement income and wealth.
SjalabaisWoWS on
Interesting that the oldest groups do not have the least share of 0 savings. Frightening, too.
frequentcannibalism on
34m New York, I’m in one of the none exist 500k-1m for under 35yo according to this chart (I’m much closer to 500k). But my retirement number is roughly 1.8m for a 69k spend in retirement. I don’t feel rich, I’m not rich, I’ll never be rich, I make under my area mean income (bottom 40% of earners), and I stress about retirement. But supposedly I’m doing well enough to be off the chart. Im convinced personally finance in the US is a circus of made up numbers.
jrralls on
It always amazes me when these charts never includes property, either investment or home. That’s usually people’s biggest asset.
Tree343 on
I’m 29 did not know that I was in the 9%.
GoldieForMayor on
This is not the most informative way to present this. When I was under 35 I was on the right side of the chart but as an older person I’m in the far left. The fact that I let money sit there for 25 years is the reason I’m on the left now.
Even-Exchange8307 on
Something is off about these numbers, how were they captured? Just surveyed?
watchhillmuscle on
I’m 40 and close to 1m in retirement but I am struggling to put together a down payment for a basic starter home in the NYC area. 120k cash up front is brutal.

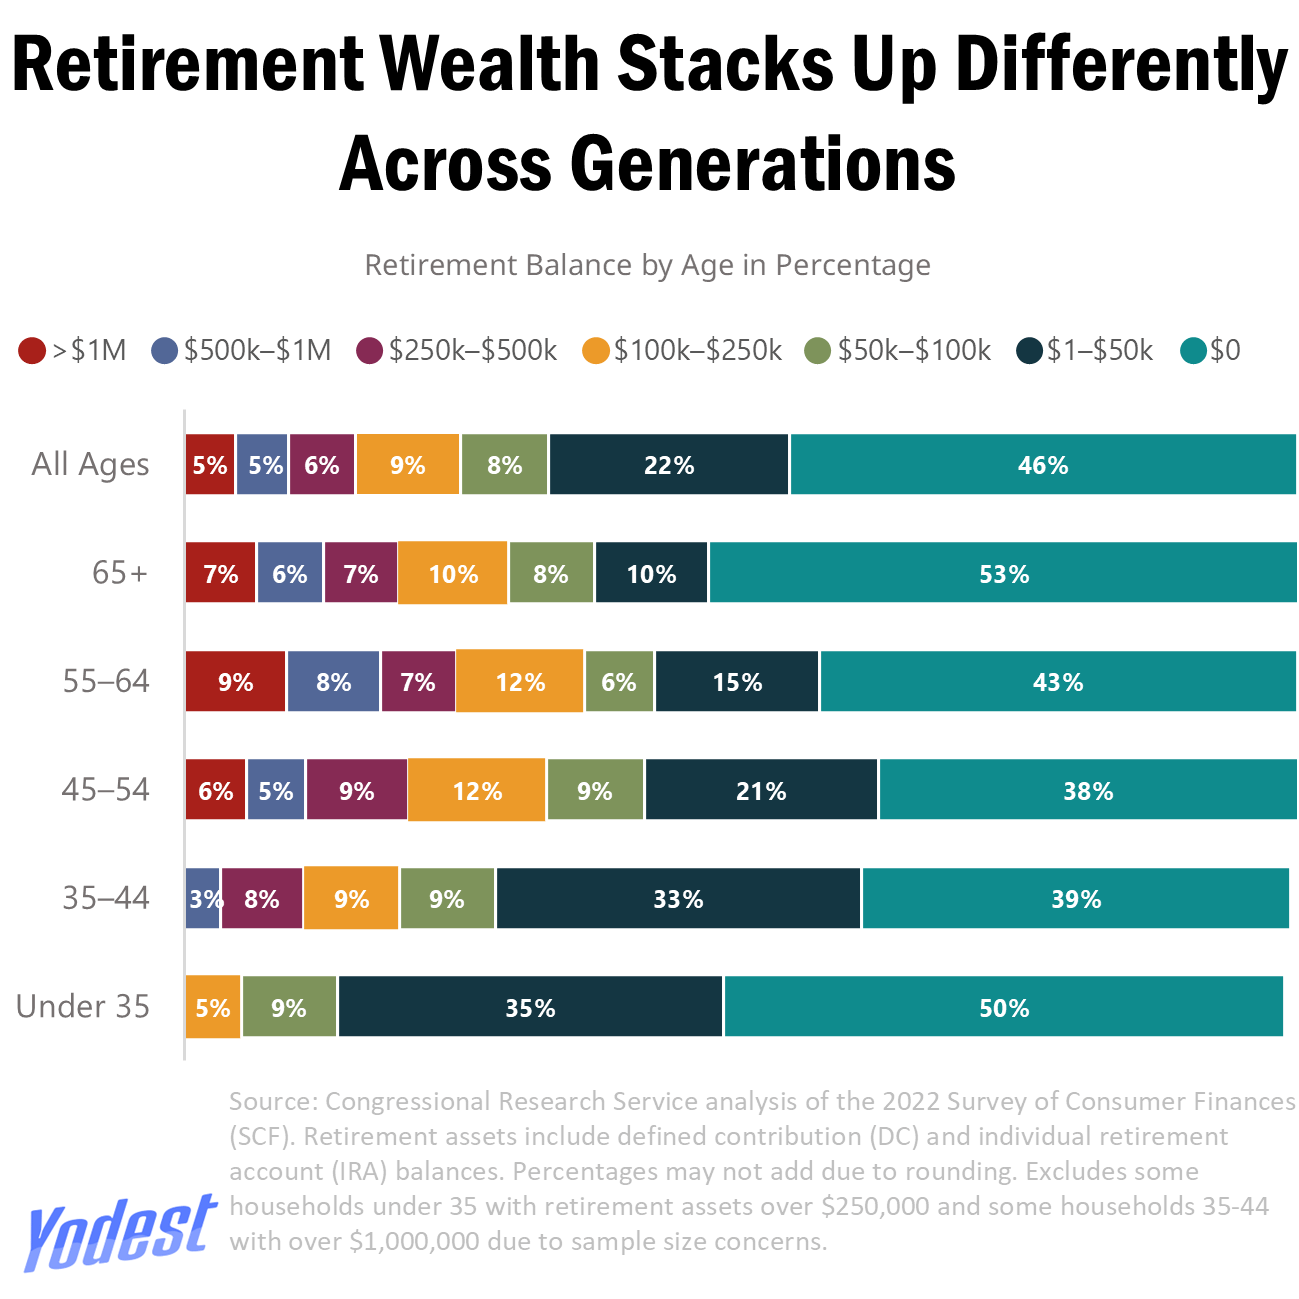
![[OC] How Much Has An Average American Saved Up For Retirement - By Age/Generation](https://www.byteseu.com/wp-content/uploads/2025/12/vbqj0t6lme7g1-1024x1024.png "[OC] How Much Has An Average American Saved Up For Retirement – By Age/Generation")
41 Comments
The 59% of 45-54 year olds with less than $50,000 saved for retirement are ngmi
Why exclude data for sample size concerns when there is no identifying information included in this chart?
Someone needs to make a PSA for /r/personalfinance
Makes sense that younger people have less savings, but it would be interesting to see each generations savings at a specific age.
This is a scary graphic…I don’t feel like I am adequately prepared for retirement and i’m in the top 20% for my age group…
Quite surprised how large the $0 is.
This looks suspiciously incorrect.
53% if 65+ have saved $0 for retirement. I’d like to know the definitions of some words and the methodology for determining this.
Maybe I’m not understanding this graph, but does the Boomer+ demo having the largest $0 proportion mean that, right now, half of that cohort have exhausted whatever savings they might have had, or does it mean they never had the savings? If the former, I’m not sure this graph is particularly helpful.
The older group had pensions. I doubt those are looked at the same as 401ks or IRAs and might explain some of the gap there.
And this is why welfare exists! No one should be going hungry or cold, especially those who can’t work anymore.
Half under 35 at 0 is fucking crazy. I’m behind by traditional advice but the top 5% in the age group. Only possible given my high income (lady luck smiled on me half a decade ago). Even if a significant portion forgoed retirement savings to buy a house now, that is a hell of a bet on real estate value.
I mean, this seems like a catastrophe waiting in the deep.
I’d like to see this as a life table, corrected for age.
Of course young people, who have more earning time and more compound-interest time ahead of them, “should” have less saved than old ones. But how were today’s 50-yos doing when they were 20?
They took out some wealthier households because of sample size concerns? that seems a bit like putting your thumb on the scale.
also, I think looking at only retirement accounts is a bit misleading since there are plenty of people who have tons of home equity value who will likely sell and move somewhere smaller and cheaper when they retire.
(I believe the decline in home values that we are seeing is going to be the thing that indirectly causes a deep recession. even if most people have low mortgage payments, they are going to cut back on spending if the see the value of their home decline and know that they need to start saving more for retirement. there will be a cascade effect from lowering home prices.)
The report calls out it does not include DB pension which was standard until like 20 years ago. So older age groups should all increase while little effect on youngest age group.
Edit: Also not included are home equity, investment accounts or even checking accounts. The data only includes IRA and DC plans. Only calling out DB as it is also a main source of retirement income.
I know shit’s fucked, but that 0 range seems incredibly high.
Is this per household or individual? And I feel like the sample size must be absolute garbage if under 35 with >250K doesn’t even make the chart.
Thumbnail looks like Brazil.
This doesn’t include 401k ? Just Ira?
The method is still unclear. Suppose a married couple have individual IRA accounts with one four times the amount in the other’s. Did they get averaged? Counted as one having above a million and the other less than 100K? It could misrepresent the household numbers.
Those over 65 actually are less likely to have more than a million in savings than those 60 years old?
I think we might need to break 65+ into multiple brackets:
65-74, 75-84, 85+
I’m curious if the retirees have spent down their savings money or if they never had it to begin with
Here is my personal graph:
https://preview.redd.it/zeksk7jvve7g1.jpeg?width=2000&format=pjpg&auto=webp&s=e292227b2540ecd26d348360cbb9c9e9167a156d
Ooof. So like over half of the populations retirement will be like an extended vacation then back to work?
And they wonder why no one is having kids.
This is terrifying. This is why financial literacy needs to be taught in schools from a young age.
This is mental to me. With my basic minimum contribution at work I’d have about £1M by the time I’m 65
TIL I’m in the top 50% for my age group with my 401k from my old job (that I need to transfer over to an IRA).
“Weird, there should be at least 1% for >$1M in the 35-44 age group based off timing for those who started saving from the get go.”
Excluded for sample size concerns.
Uh huh… probably similar financial trajectory as the group of under 35 with retirement assets over $250,000, incidentally also excluded.
I track down the source data because this looks wrong: [https://www.congress.gov/crs-product/IF12928#_Ref187924327](https://www.congress.gov/crs-product/IF12928#_Ref187924327)
The big caveat here is, this only counts DC (like 401k) and IRA account. Many household have defined benefit (DB) pensions plan instead (teacher, police unions, some large automotive companies etc. [About 12% of 65+ retirees aged 65+ received 90%](https://www.census.gov/library/working-papers/2017/demo/SEHSD-WP2017-39.html) or more of their income from Social Security. So the true ‘none’ is closer to 10% and not 53%.
Half of Americans over 65 have 0 savings. Thats frightening and sad
Imho not so uncommon. People inherit from their parents. The young generation’s wealth is not theirs yet but their parents.
Compound interest is a hell of a drug. Current retirement age is 67. People become adults at 18.
$150 a month for 49 years is $1,200,000 at 9% returns.
Problem with ‘data’ like this is that it’s just flat up not representing what the title describes. While if you look in the small print, 46% of people overall may indeed _not have a defined contribution or Individual Retirement Account_, vast numbers of that 46% will have balances, some quite substantial some less so, that will serve them in retirement, simply held in other vehicles such as markets, ordinary savings accounts, other assets of varying liquidity, etc.
How can this be true? On social media/reddit alone I see Millennials and Gen Z talking about their $500k+ portfolios left and right.
I wonder if this is asking individuals for their retirement net worth versus surveying account balances from the investment brokerage side.
Because I, like many, have accounts with more than one investment companies (one with Vanguard, one with Fidelity, and one with TIAA). The sum of these is in a different bracket than any one considered alone.
Only counting assets in retirement accounts or pensions, I’d say this is missing a huge amount of higher earner wealth. Most folks working in tech or finance often have most wealth in RSU and ESPPs, and these are fully outside 401k or will exceed annual pre-tax limits.
Oh, and also doesn’t count the value defined payment pensions, which are semi-common for older people. Really, this isn’t that valuable without these major sources of retirement income and wealth.
Interesting that the oldest groups do not have the least share of 0 savings. Frightening, too.
34m New York, I’m in one of the none exist 500k-1m for under 35yo according to this chart (I’m much closer to 500k). But my retirement number is roughly 1.8m for a 69k spend in retirement. I don’t feel rich, I’m not rich, I’ll never be rich, I make under my area mean income (bottom 40% of earners), and I stress about retirement. But supposedly I’m doing well enough to be off the chart. Im convinced personally finance in the US is a circus of made up numbers.
It always amazes me when these charts never includes property, either investment or home. That’s usually people’s biggest asset.
I’m 29 did not know that I was in the 9%.
This is not the most informative way to present this. When I was under 35 I was on the right side of the chart but as an older person I’m in the far left. The fact that I let money sit there for 25 years is the reason I’m on the left now.
Something is off about these numbers, how were they captured? Just surveyed?
I’m 40 and close to 1m in retirement but I am struggling to put together a down payment for a basic starter home in the NYC area. 120k cash up front is brutal.