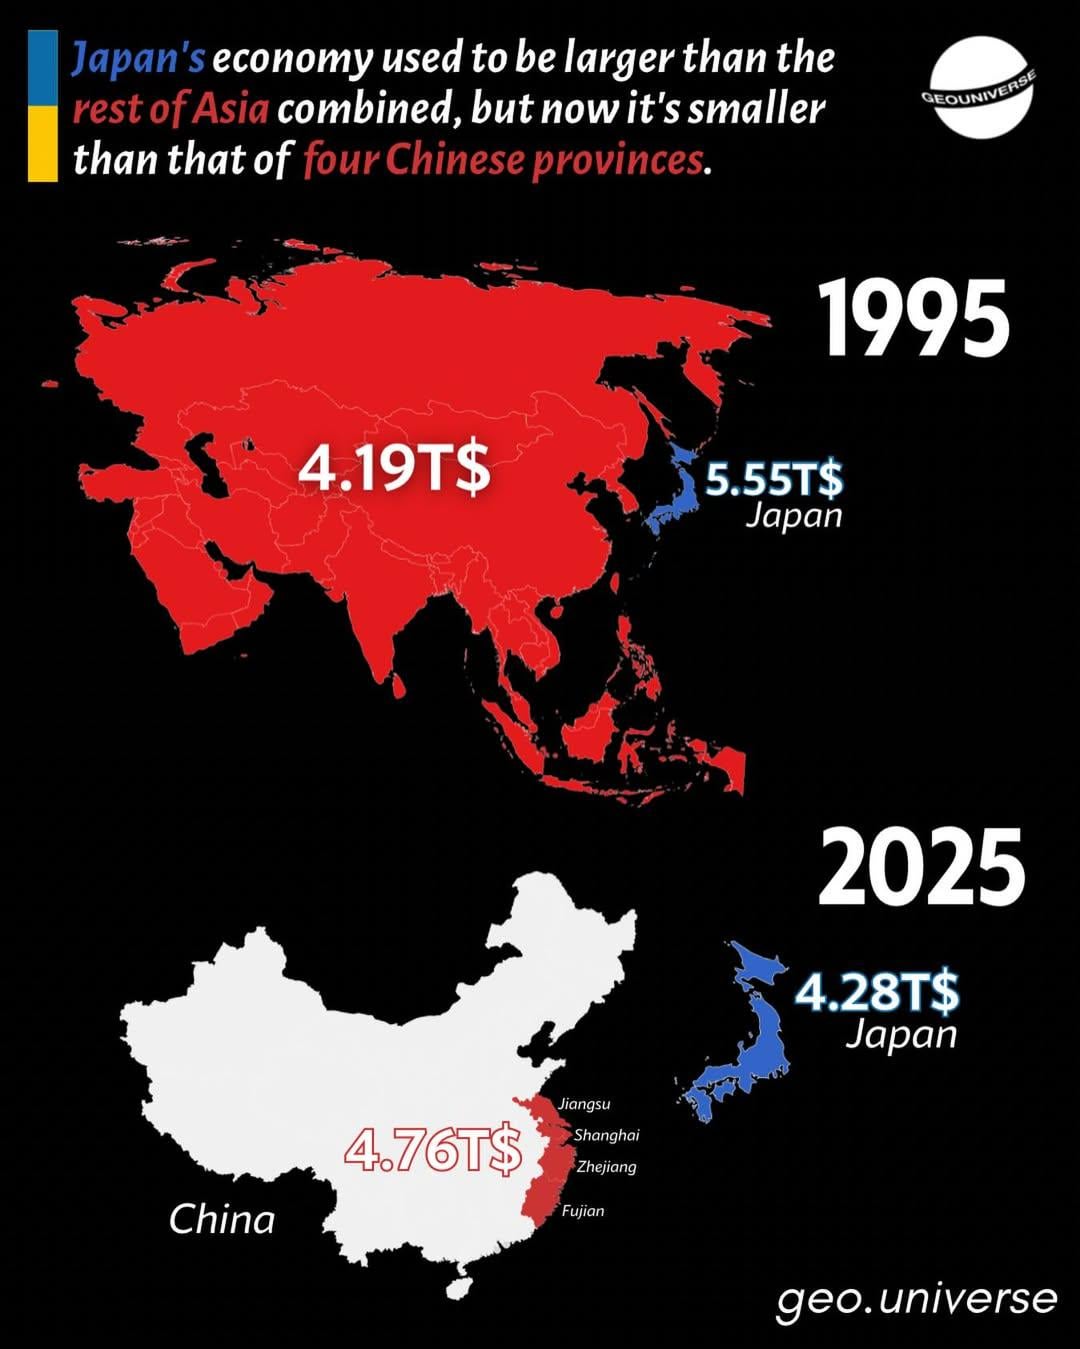
In 1995, Japan’s economy was larger than all of Asia combined. Fast forward to today, and its GDP is now smaller than just four Chinese provinces — Jiangsu, Shanghai, Zhejiang, and Fujian.
Pochel on
China’s progress is truly impressive
Not a fan of the CCP but I guess they know what they’re doing
scancx-com on
China’s provinces are basically countries in scale.
Emilia963 on
There is some nuance to this:
GDP can go up just because the population is growing and more infrastructure is being built
To really compare how developed countries are and how well their people are doing, it makes more sense to look at GDP per capita rather than total GDP
pkstr11 on
Cool. By another marker, GDP per capita, Japan is around 3 times higher than China.
Pretty_Ad4908 on
Japan is no longer what it used to be, it’s so weak nowadays
sleepyrivertroll on
There are three types of economies in the world, developed, developing, and Japan.
Nomad-2020 on
China should have been outlined on the first map.
Nomad-2020 on
How much GDP is the rest of Asia in 2025, excluding China and Japan?
Apart_Welcome4633 on
china number 1 it is known
podlaski-dzikus on
A bit wierd map, since Japan’s conomy is still twice bigger than the whole of Russia ($2.54 trillion).
Why not compare to China only then?!
Deep_Head4645 on
1995 was impressive asf though
Won against an entire continent
Remind me again what happened? Why did they fall today?
littypika on
I think this is less about Japan’s economic “downturn”, but more so China’s exponential economic rise.
kartu3 on
#I call BS.
Coastline is the most densely populated part of the Chinese territory.
This map gives the wrong impression.
China’s entire GDP is 19.4 trillion.
Japan’s 1995 GDP figure is nominal. PPP value is $2.14 trillion.
ale_93113 on
I am as pro China as people on this app can be, but this is disingenuous, since this is taking high cost of living provinces, and also, Japan’s Gdp has not actually declined in real terms
Done a comparison of Gdp PPP yield a similar picture in 2025, but in 1995 Japan was not AS powerful as this makes it look
Believe it or not Japan has not shrink it’s economy
kakje666 on
those 4 provinces have like 230 million people, which is nearly twice as big as Japan’s 122 million population
not to mention that Japan’s GDP per capita is 3 times bigger than China’s
the rise is very impressive, but there is still room for improvement
wiswin on
What do you expect from a country whose population is shrinking?
BainbridgeBorn on
Japan be unc-ified
cookiesnooper on
What does that have to do with Ukraine?
Veanusdream on
the guy who made the top map really dont know where asia ends
Mountain_Welder5234 on
More like Asia’s economic shift…
No_pajamas_7 on
Its rest of east Asia’s shift, not just Japan’s.
Mindless_Bid_5162 on
China has more than a billion people. It’s supposed to be bigger than Japan 😭
NefariousnessFit3133 on
Japan traded industry for Service economy like all developed countries except for Germany which had been slow to transition. USA, UK, most of weatern Europe and in the future China as well. Inflation of wages, office and retail work replaces manual work and so on.
You need to include Service Export as well as physical goods Export see that hand off from physical goods to services export. USA, Japan, Europe etc. And even China is shifting as we speak, more Services export and a little less goods export which will greatly continue in decades to come as China shifts to Services.
That was literally caused by the USA. The Plaza accord send their economy to limbo.
No_Communication5538 on
Wow, this OP is definitely the hardest working bot on Reddit – 23 posts in the last 24 hours
IndependenceLive3786 on
A better title: China’s economic ascendancy
Usual_Macaroon_4063 on
China. This democratic country! Oh, wait! The citizens are not allowed to do what they want!
D0ML0L1Y401TR4PFURRY on
Cccrazy
Lost_Arotin on
In 2010, after some limitations China dropped on its exportatins of strategic minerals to Japan, after some sort of political and cutural tention, Japan lost all of its edge in technology.
That was when South Korea took the lead in technological advances.
Don’t underestimate those 4-6 provinces. They’re the tech hubs of China. They export everywhere.
_CHIFFRE on
Reminder that GDP without PPP doesn’t show Economic size as it shows output+prices without adjusting to price level/cost of living, currency fluctuations and inflation. PPPs were first developed in 1968 by the Uni of Pennsylvania and the UN who created the [ICP](https://en.wikipedia.org/wiki/International_Comparison_Program) (International Comparison Program), it has become widely adopted with the ICP’s main partners being the World Bank, IMF, ADB, AfDB, Eurostat and OECD.
[The World Bank](https://en.wikipedia.org/wiki/List_of_countries_by_GNI_(PPP)_per_capita#Purchasing_Power_Parity_(PPP)):”Typically, higher income countries have higher price levels, while lower income countries have lower price levels ([Balassa–Samuelson effect](https://en.wikipedia.org/wiki/Balassa%E2%80%93Samuelson_effect)). Market exchange rate-based cross-country comparisons of GDP at its expenditure components reflect both differences in economic outputs (volumes) and prices. Given the differences in price levels, the (economic) size of higher income countries is inflated, while the size of lower income countries is depressed in the comparison. PPP-based cross-country comparisons of GDP at its expenditure components only reflect differences in economic outputs (volume), as PPPs control for price level differences between the countries. Hence, the comparison reflects the real (economic) size of the countries.”
More from [The World Bank](https://data.worldbank.org/indicator/NY.GDP.MKTP.PP.CD) (Click **ⓘ Details** for explanation):”PPPs account for the different price levels across countries and thus PPP-based comparisons of economic output are more appropriate for comparing the output of economies and the average material well-being of their inhabitants than exchange-rate based comparisons.”
[OECD](https://www.oecd.org/en/data/insights/data-explainers/2024/06/purchasing-power-parities—frequently-asked-questions-faqs.html#PPPs3):”The major use of PPPs is as a first step in making inter-country comparisons in real terms of gross domestic product (GDP) and its component expenditures. Calculating PPPs is the first step in the process of converting the level of GDP and its major aggregates, expressed in national currencies, into a common currency to enable these comparisons to be made.” (OECD are 38 mostly western countries)
But per capita it’s not close, so react. China has a larger pie but it’s for 1000 ppl. Japan only has to feed 100 with the same size
schtickshift on
Is that Japans economic shift or everyone else’s?
budbud70 on
Yeah well that’s fucking Shanghai right there lol
proceduralpaz on
Just makes me think, it would have been nice to visit Japan in the mid 90s.
That’s what people say anyway, Japan is what the future looks like, from the view point of the 90s.
macrocosm93 on
The real story here isn’t Japan, it’s China.
I think a lot of people are really underestimating how dominant China is going to be in the coming decades. They still have a ton of room for growth.
ThinkedThought on
Just for reference, these aren’t the four highest provinces in China. Guangdong is 1 or 2 and Shandong is 3 or 4. Shanghai would only be like 8-10.
Repulsive_Work_226 on
what a change in 30 years.
even if you exclude China, Japan will still be far behind if you compare with the total Asian countries

")
39 Comments
In 1995, Japan’s economy was larger than all of Asia combined. Fast forward to today, and its GDP is now smaller than just four Chinese provinces — Jiangsu, Shanghai, Zhejiang, and Fujian.
China’s progress is truly impressive
Not a fan of the CCP but I guess they know what they’re doing
China’s provinces are basically countries in scale.
There is some nuance to this:
GDP can go up just because the population is growing and more infrastructure is being built
To really compare how developed countries are and how well their people are doing, it makes more sense to look at GDP per capita rather than total GDP
Cool. By another marker, GDP per capita, Japan is around 3 times higher than China.
Japan is no longer what it used to be, it’s so weak nowadays
There are three types of economies in the world, developed, developing, and Japan.
China should have been outlined on the first map.
How much GDP is the rest of Asia in 2025, excluding China and Japan?
china number 1 it is known
A bit wierd map, since Japan’s conomy is still twice bigger than the whole of Russia ($2.54 trillion).
Why not compare to China only then?!
1995 was impressive asf though
Won against an entire continent
Remind me again what happened? Why did they fall today?
I think this is less about Japan’s economic “downturn”, but more so China’s exponential economic rise.
#I call BS.
Coastline is the most densely populated part of the Chinese territory.
This map gives the wrong impression.
China’s entire GDP is 19.4 trillion.
Japan’s 1995 GDP figure is nominal. PPP value is $2.14 trillion.
I am as pro China as people on this app can be, but this is disingenuous, since this is taking high cost of living provinces, and also, Japan’s Gdp has not actually declined in real terms
Done a comparison of Gdp PPP yield a similar picture in 2025, but in 1995 Japan was not AS powerful as this makes it look
Believe it or not Japan has not shrink it’s economy
those 4 provinces have like 230 million people, which is nearly twice as big as Japan’s 122 million population
not to mention that Japan’s GDP per capita is 3 times bigger than China’s
the rise is very impressive, but there is still room for improvement
What do you expect from a country whose population is shrinking?
Japan be unc-ified
What does that have to do with Ukraine?
the guy who made the top map really dont know where asia ends
More like Asia’s economic shift…
Its rest of east Asia’s shift, not just Japan’s.
China has more than a billion people. It’s supposed to be bigger than Japan 😭
Japan traded industry for Service economy like all developed countries except for Germany which had been slow to transition. USA, UK, most of weatern Europe and in the future China as well. Inflation of wages, office and retail work replaces manual work and so on.
You need to include Service Export as well as physical goods Export see that hand off from physical goods to services export. USA, Japan, Europe etc. And even China is shifting as we speak, more Services export and a little less goods export which will greatly continue in decades to come as China shifts to Services.
That is not a map of Asia, but this is: [https://www.reddit.com/r/MapPorn/comments/1kj7b5t/asia/](https://www.reddit.com/r/MapPorn/comments/1kj7b5t/asia/)
That was literally caused by the USA. The Plaza accord send their economy to limbo.
Wow, this OP is definitely the hardest working bot on Reddit – 23 posts in the last 24 hours
A better title: China’s economic ascendancy
China. This democratic country! Oh, wait! The citizens are not allowed to do what they want!
Cccrazy
In 2010, after some limitations China dropped on its exportatins of strategic minerals to Japan, after some sort of political and cutural tention, Japan lost all of its edge in technology.
That was when South Korea took the lead in technological advances.
Don’t underestimate those 4-6 provinces. They’re the tech hubs of China. They export everywhere.
Reminder that GDP without PPP doesn’t show Economic size as it shows output+prices without adjusting to price level/cost of living, currency fluctuations and inflation. PPPs were first developed in 1968 by the Uni of Pennsylvania and the UN who created the [ICP](https://en.wikipedia.org/wiki/International_Comparison_Program) (International Comparison Program), it has become widely adopted with the ICP’s main partners being the World Bank, IMF, ADB, AfDB, Eurostat and OECD.
[The World Bank](https://en.wikipedia.org/wiki/List_of_countries_by_GNI_(PPP)_per_capita#Purchasing_Power_Parity_(PPP)):”Typically, higher income countries have higher price levels, while lower income countries have lower price levels ([Balassa–Samuelson effect](https://en.wikipedia.org/wiki/Balassa%E2%80%93Samuelson_effect)). Market exchange rate-based cross-country comparisons of GDP at its expenditure components reflect both differences in economic outputs (volumes) and prices. Given the differences in price levels, the (economic) size of higher income countries is inflated, while the size of lower income countries is depressed in the comparison. PPP-based cross-country comparisons of GDP at its expenditure components only reflect differences in economic outputs (volume), as PPPs control for price level differences between the countries. Hence, the comparison reflects the real (economic) size of the countries.”
More from [The World Bank](https://data.worldbank.org/indicator/NY.GDP.MKTP.PP.CD) (Click **ⓘ Details** for explanation):”PPPs account for the different price levels across countries and thus PPP-based comparisons of economic output are more appropriate for comparing the output of economies and the average material well-being of their inhabitants than exchange-rate based comparisons.”
[OECD](https://www.oecd.org/en/data/insights/data-explainers/2024/06/purchasing-power-parities—frequently-asked-questions-faqs.html#PPPs3):”The major use of PPPs is as a first step in making inter-country comparisons in real terms of gross domestic product (GDP) and its component expenditures. Calculating PPPs is the first step in the process of converting the level of GDP and its major aggregates, expressed in national currencies, into a common currency to enable these comparisons to be made.” (OECD are 38 mostly western countries)
[Bruegel](https://www.bruegel.org/analysis/european-unions-remarkable-growth-performance-relative-united-states):”The right metric for international comparisons is purchasing power parity (PPP)-adjusted output. This corrects for exchange rate fluctuations and differences in various national prices.” (18 European member countries and dozends of Financial institutions and Corporate members)
[IMF: PPP vs Market rates](https://www.imf.org/external/pubs/ft/fandd/basics/44-purchasing-power-parity.htm) – [IMF: Share of World Economy](https://www.imf.org/external/datamapper/PPPSH@WEO/JPN/CHN/IND/USA/DEU/RUS/EU)
But per capita it’s not close, so react. China has a larger pie but it’s for 1000 ppl. Japan only has to feed 100 with the same size
Is that Japans economic shift or everyone else’s?
Yeah well that’s fucking Shanghai right there lol
Just makes me think, it would have been nice to visit Japan in the mid 90s.
That’s what people say anyway, Japan is what the future looks like, from the view point of the 90s.
The real story here isn’t Japan, it’s China.
I think a lot of people are really underestimating how dominant China is going to be in the coming decades. They still have a ton of room for growth.
Just for reference, these aren’t the four highest provinces in China. Guangdong is 1 or 2 and Shandong is 3 or 4. Shanghai would only be like 8-10.
what a change in 30 years.
even if you exclude China, Japan will still be far behind if you compare with the total Asian countries