
![[OC] FIFA World Cup all-time table: Top 25 teams by total points (as of Dec 2025)](https://www.byteseu.com/wp-content/uploads/2025/12/wmnds9bj0y7g1-1304x1536.png "[OC] FIFA World Cup all-time table: Top 25 teams by total points (as of Dec 2025)")
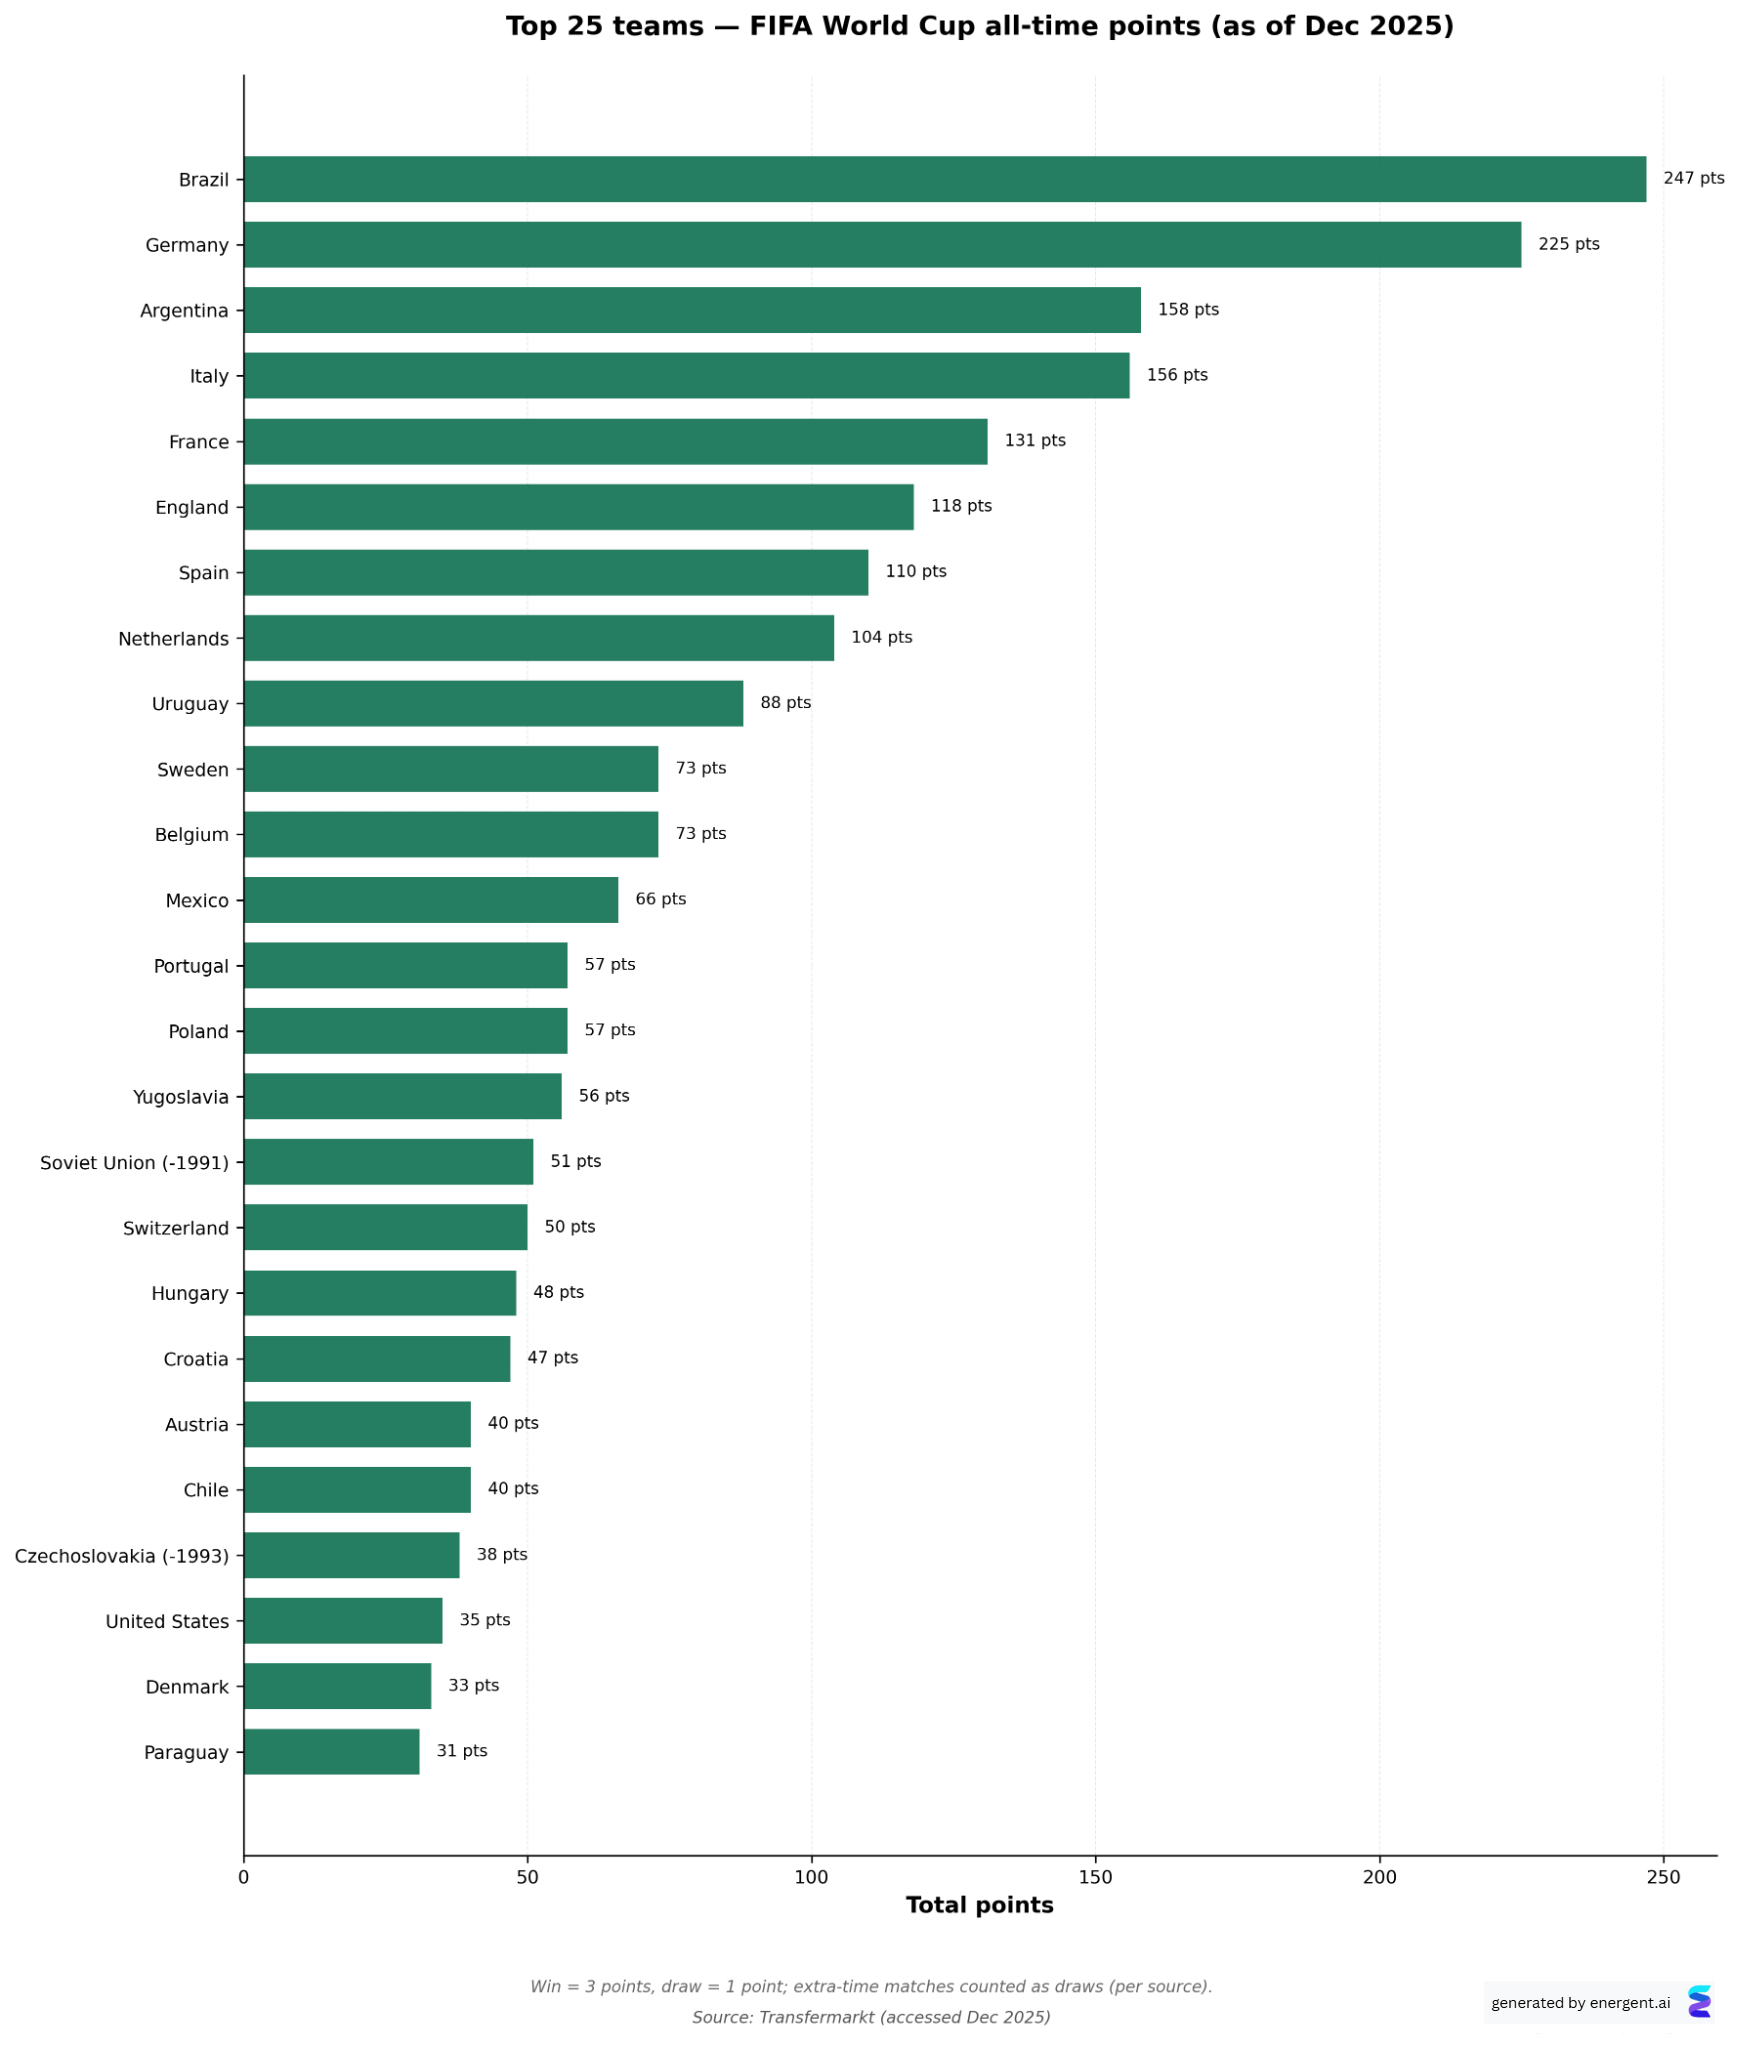
Horizontal bar chart ranking the top 25 national teams by total points in FIFA World Cup match history (as of Dec 2025). Points follow the source’s scoring definition (win = 3, draw = 1; extra-time matches counted as draws per source).
Visualization generated with Energent AI.
Posted by Fantastic-Spirit9974
9 Comments
[OC] Source + method + tools
Source:
Transfermarkt — “World Cup – All time standings”
[https://www.transfermarkt.com/weltmeisterschaft/ewigeTabelle/pokalwettbewerb/FIWC](https://www.transfermarkt.com/weltmeisterschaft/ewigeTabelle/pokalwettbewerb/FIWC)
Method:
Used the “Points” column from the all-time standings table and plotted the top 25 teams in descending order.
Scoring per source: win = 3 pts, draw = 1 pt; extra-time matches counted as draws.
Tools:
Energent AI (visualization).
England in front of Spain is ridiculous
Ofc Netherlands have the most without winning the cup.
Germany not participating 1930 and 1950…
Thanks. Could you easily do the same for last 20 years ? Txs
Fun follow-up question: what’s the “best” way to rank all-time performance?
– total points (this post)
– points per match (efficiency)
– % win rate
– Elo peak
If you want, I can post an efficiency version next: points per match (min 20+ matches).
It’s crazy to see how Italy is a lot closer to Argentina and other European teams than to Germany, even though both won it four times
Poland ranks 14th, that’s really much better than I had expected. As far as modern-day world cups go, we only made it past the group stage once. But we did have a pretty solid team in the 1970s and early 1980s. Our spot is probably a remnant of those days.
Chile being on the list is a surprise to me. We’ve always been a weaker team in South America with occasional periods of great squads.
I mean right now the team is back to its “horribly bad” roots after having the best squads in its history, the “Golden Generation”