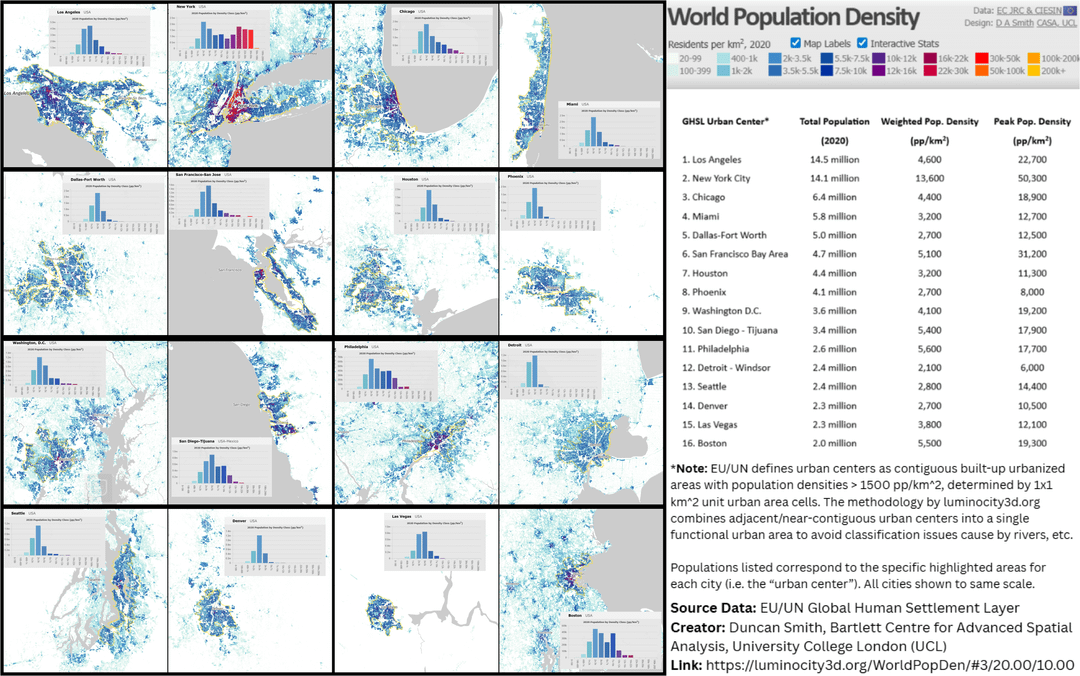
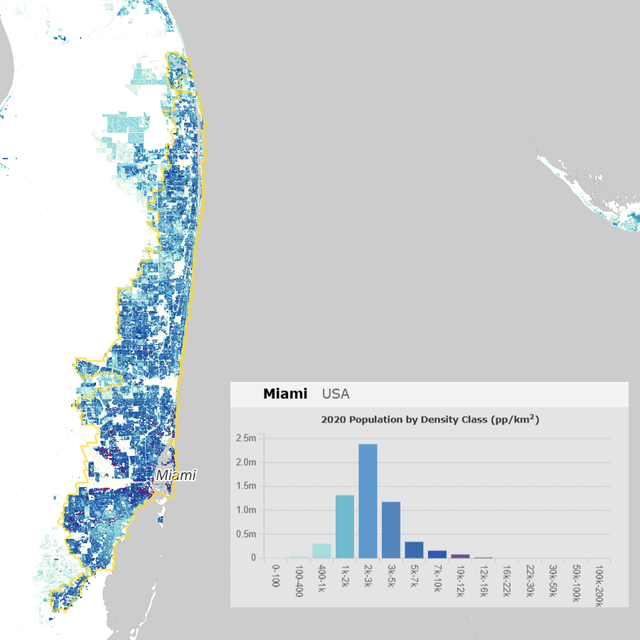
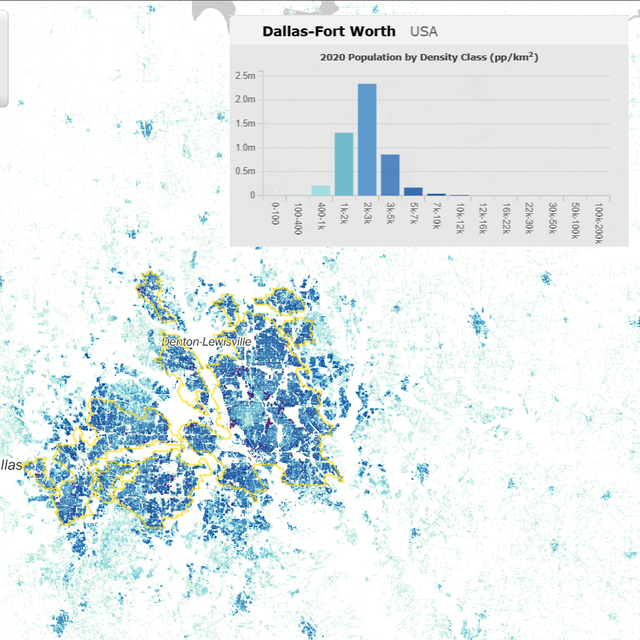
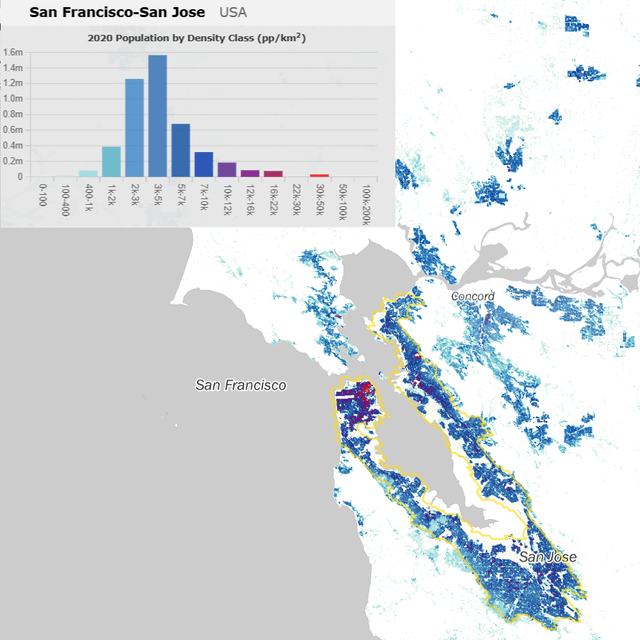
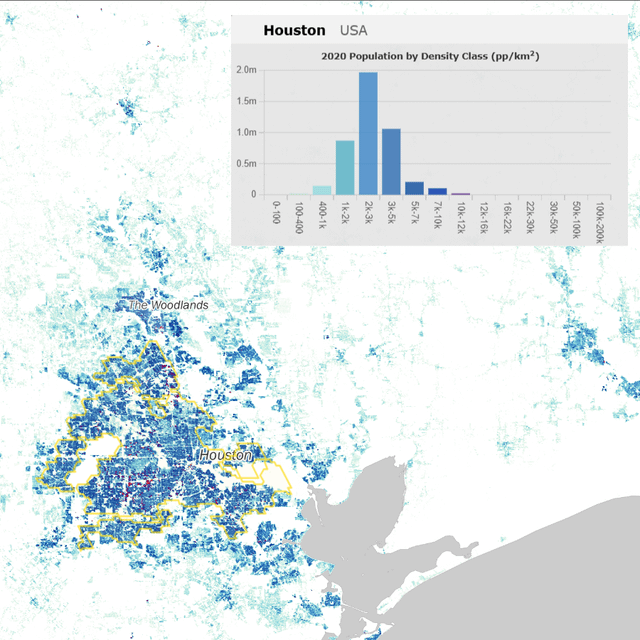
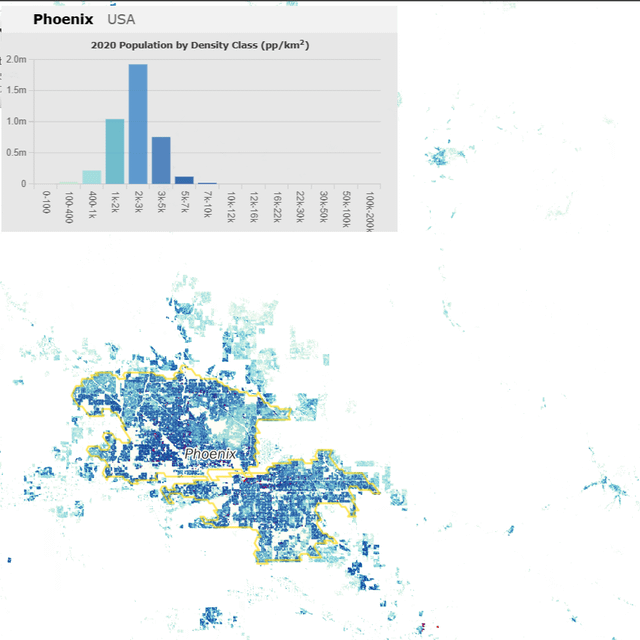
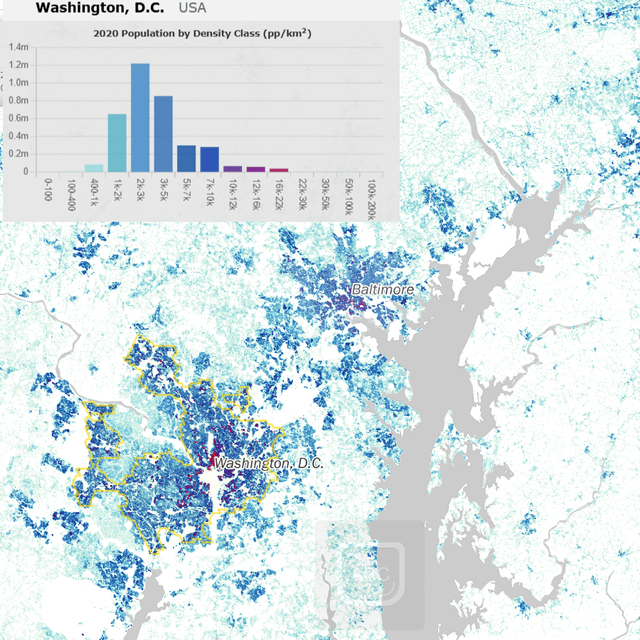
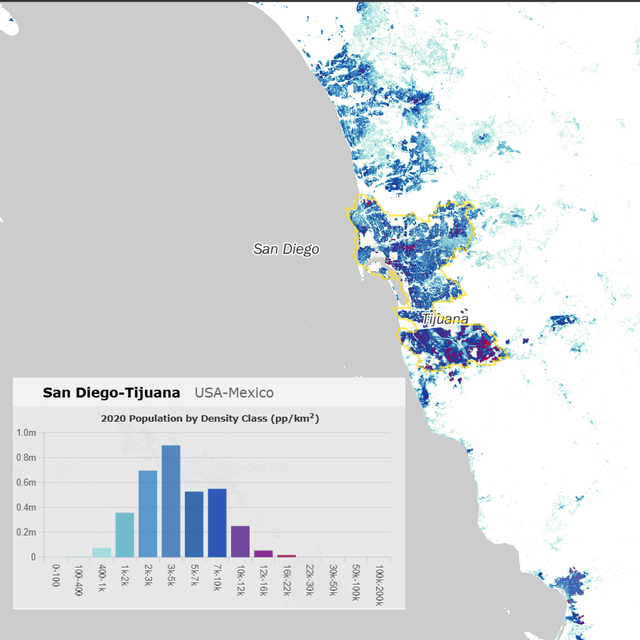
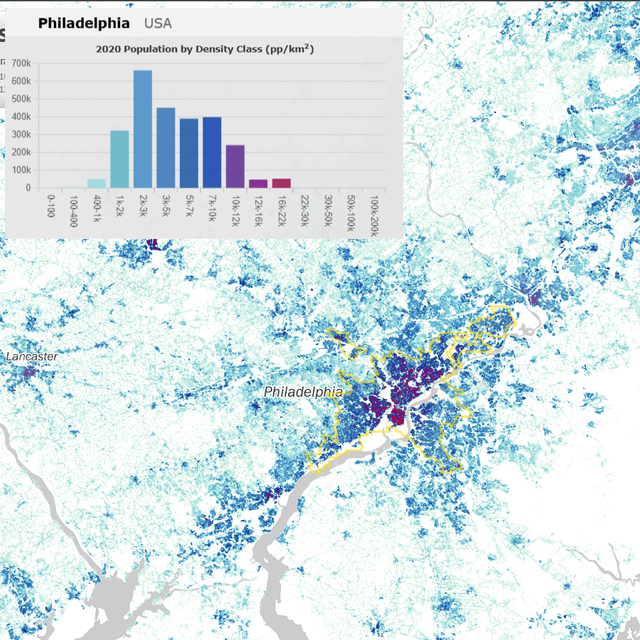
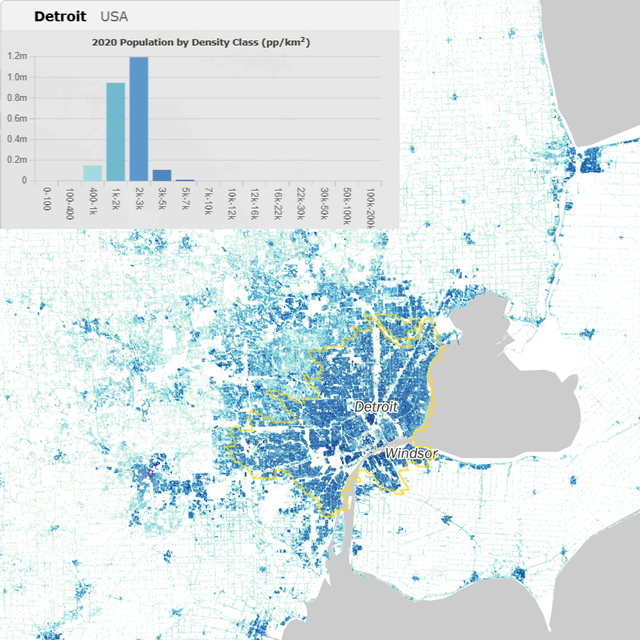
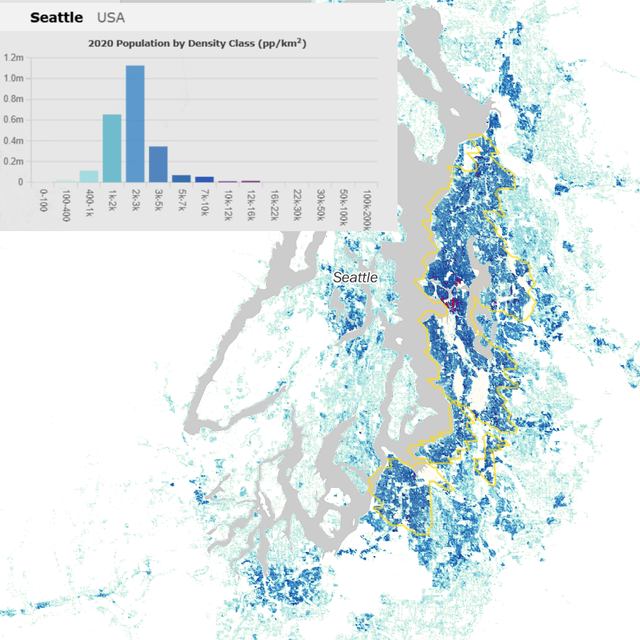
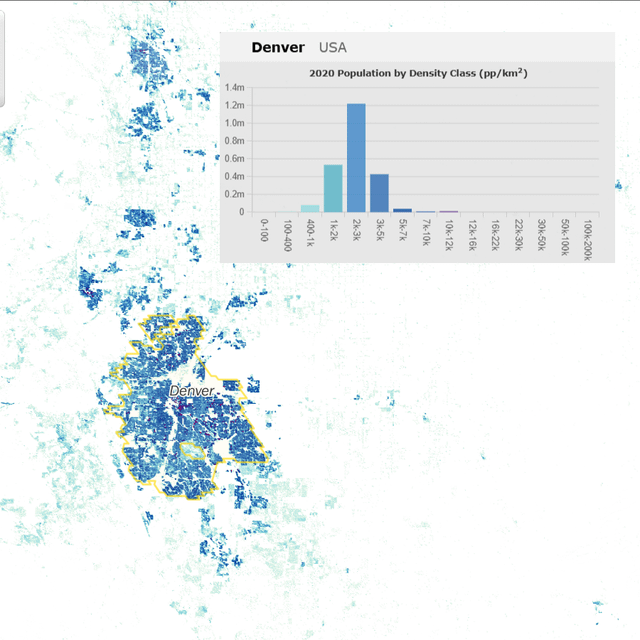
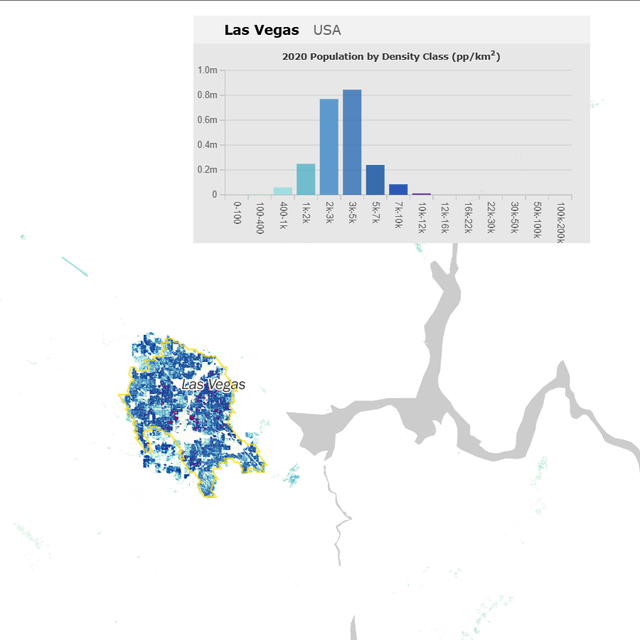
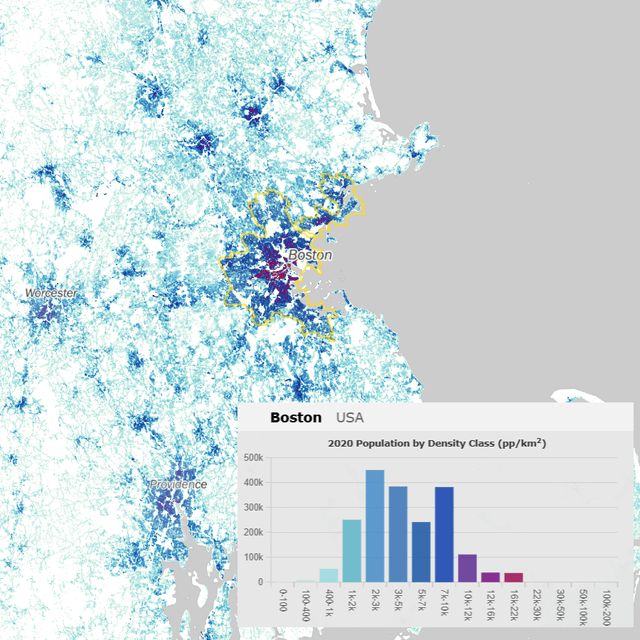
The UN/EU Global Human Settlement Layer Database defines an urban area, or urban center, as a contiguous built-up area with population densities >= 1,500 pp/km^2, while the US Census Bureau defined a contiguous urban area with a population density threshold of just 193-386 pp/km^2 (or 500-1000 pp/sq. mi.). Alot of American low-density suburban or exurban development would in other countries count as verging on semi-rural/countryside, and definitively would not be considered urban in most countries (e.g. US Census Bureau’s urban density threshold would merge much of Southern and Central England, Central Europe, or the entire Tokyo-Nagoya-Osaka corridor of Japan, as one single urban area, which is silly).
Here, the 16 of the largest US urban areas with populations > 2 million are ranked based on the UN/EU threshold, with data collected from UN/EU GHSL data by Duncan Smith of Bartlett Centre for Advanced Spatial Analysis at UCL, and organized and designed this map viewer based on the data: [https://luminocity3d.org/WorldPopDen/#3/20.00/10.00](https://luminocity3d.org/WorldPopDen/#3/20.00/10.00)
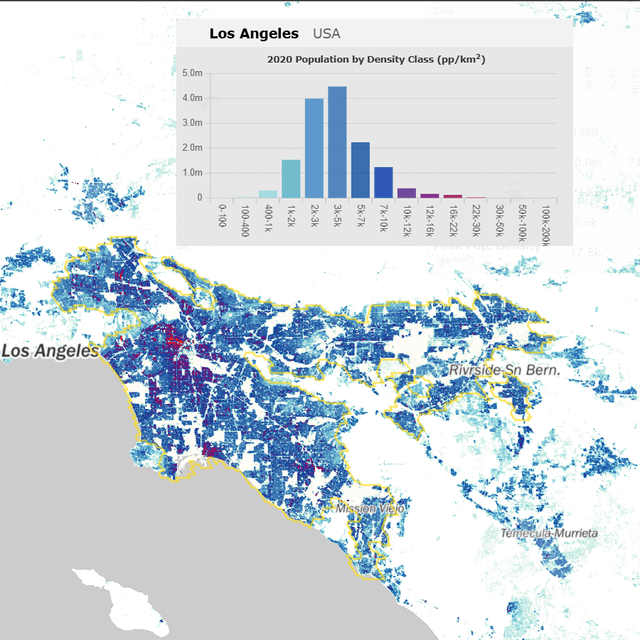
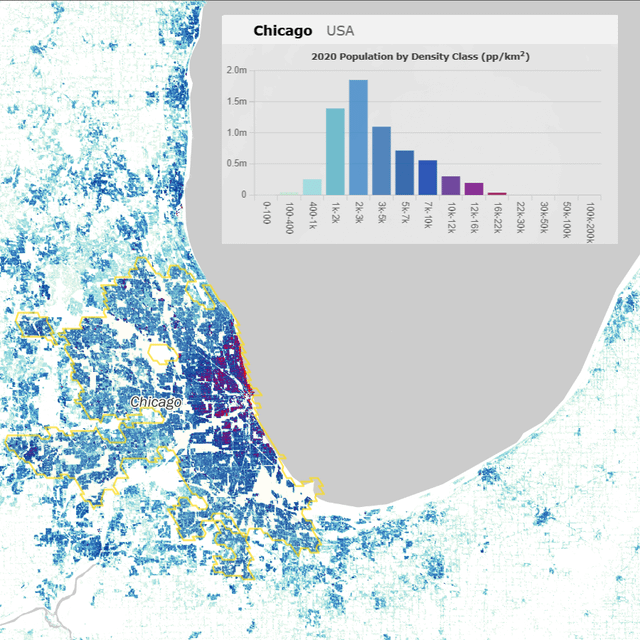
All cities are shown at the same scale. Due to odd classification quirks from the strict UN standard from the previous post, such as Dallas, Phoenix, or Chicago being segmented into different urban areas due to river, lakes, or parks, Smith combines adjacent urban areas with small separation due to rivers as a single functional urban center. The density standard seems to work very well now for most US cities compared to the previous post.
garteguy101 on
I like that you combined metros separated by a (well-connected) river, like Phoenix which has dozens of bridges over it. Nice graphics!
masseydnc on
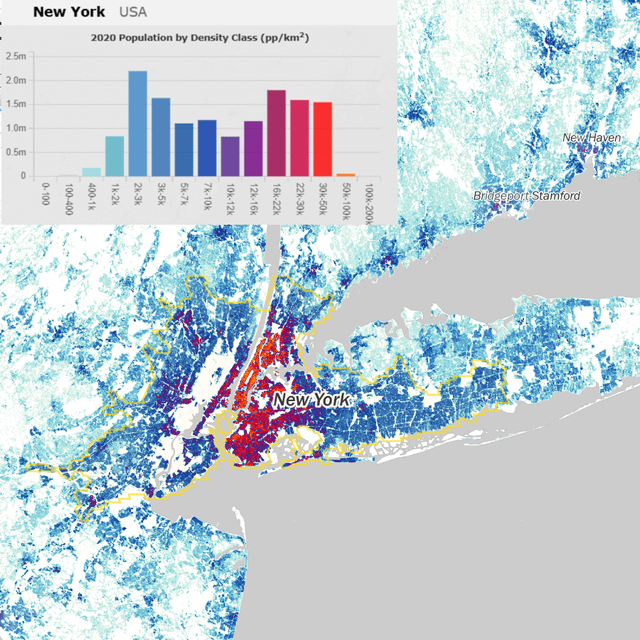
New York City’s bar charts are notably different from the other 15 cities. It’s just in a different category than any other city in America — which other cities around the world would be so heavily weighted on the right side of the graph (rather than tapering off)?

![Population & Densities of 16 Largest US Urban Areas based on UN/EU GHSL Data [OC]](https://www.byteseu.com/wp-content/uploads/2025/12/q35mm3g01z7g1-1024x641.png "Population & Densities of 16 Largest US Urban Areas based on UN/EU GHSL Data [OC]")
3 Comments
The UN/EU Global Human Settlement Layer Database defines an urban area, or urban center, as a contiguous built-up area with population densities >= 1,500 pp/km^2, while the US Census Bureau defined a contiguous urban area with a population density threshold of just 193-386 pp/km^2 (or 500-1000 pp/sq. mi.). Alot of American low-density suburban or exurban development would in other countries count as verging on semi-rural/countryside, and definitively would not be considered urban in most countries (e.g. US Census Bureau’s urban density threshold would merge much of Southern and Central England, Central Europe, or the entire Tokyo-Nagoya-Osaka corridor of Japan, as one single urban area, which is silly).
Here, the 16 of the largest US urban areas with populations > 2 million are ranked based on the UN/EU threshold, with data collected from UN/EU GHSL data by Duncan Smith of Bartlett Centre for Advanced Spatial Analysis at UCL, and organized and designed this map viewer based on the data: [https://luminocity3d.org/WorldPopDen/#3/20.00/10.00](https://luminocity3d.org/WorldPopDen/#3/20.00/10.00)
All cities are shown at the same scale. Due to odd classification quirks from the strict UN standard from the previous post, such as Dallas, Phoenix, or Chicago being segmented into different urban areas due to river, lakes, or parks, Smith combines adjacent urban areas with small separation due to rivers as a single functional urban center. The density standard seems to work very well now for most US cities compared to the previous post.
I like that you combined metros separated by a (well-connected) river, like Phoenix which has dozens of bridges over it. Nice graphics!
New York City’s bar charts are notably different from the other 15 cities. It’s just in a different category than any other city in America — which other cities around the world would be so heavily weighted on the right side of the graph (rather than tapering off)?