Do you put your holiday lights up right after Thanksgiving?
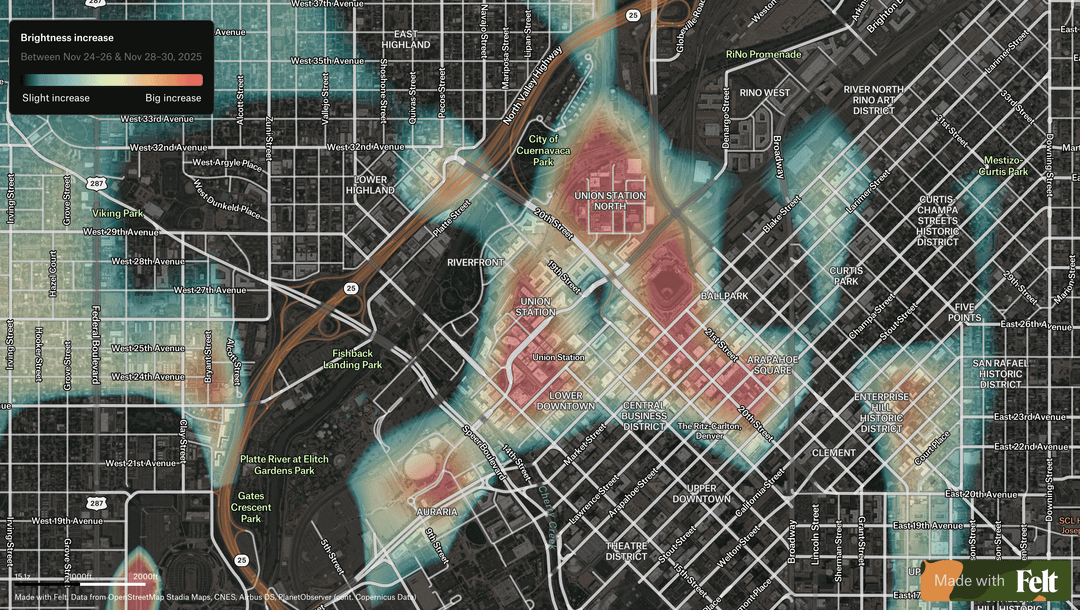
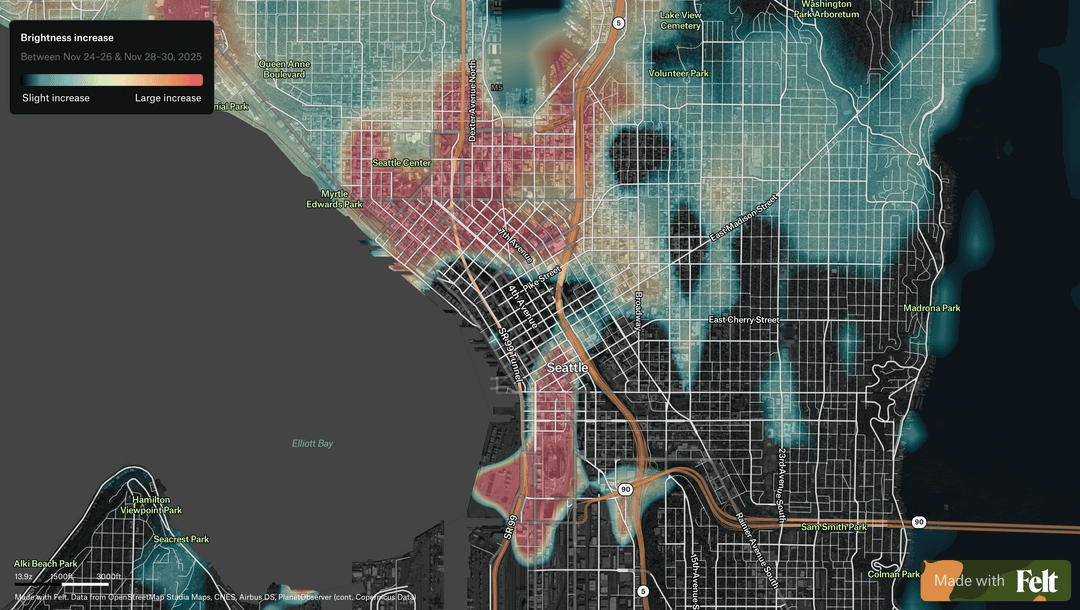
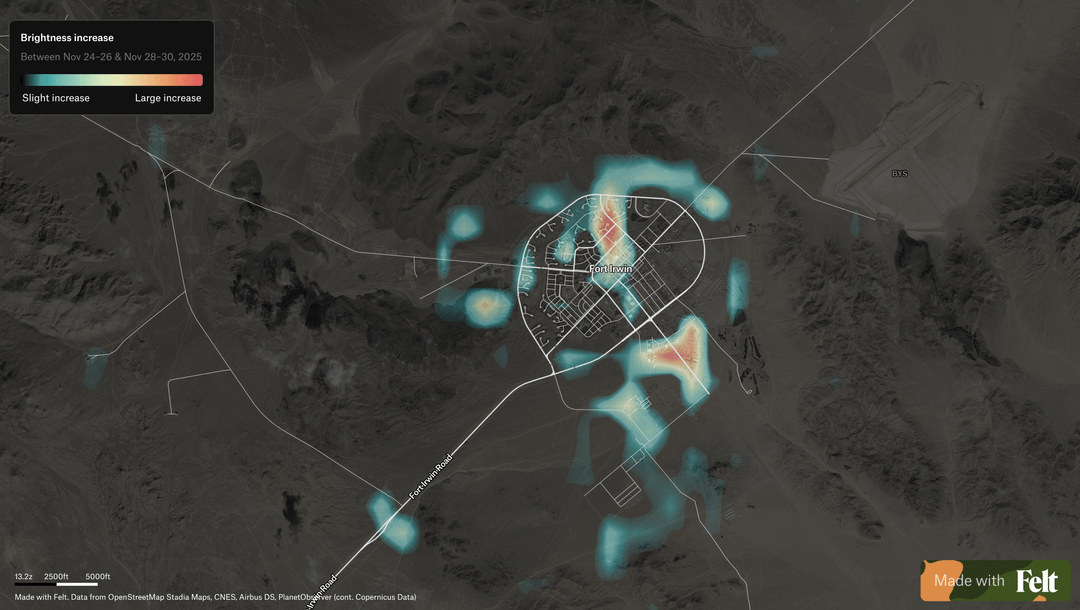
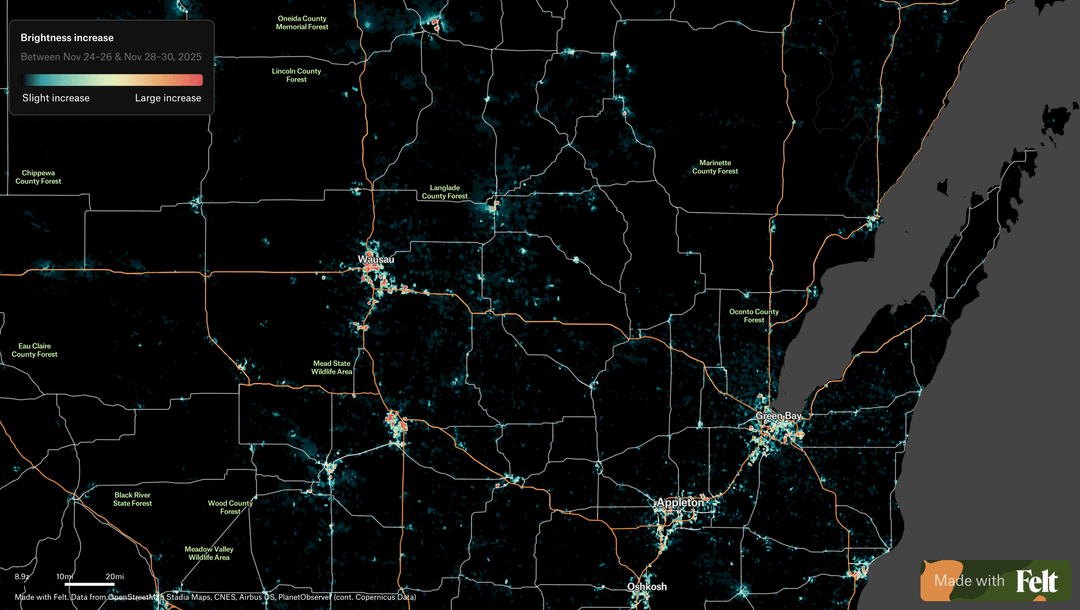
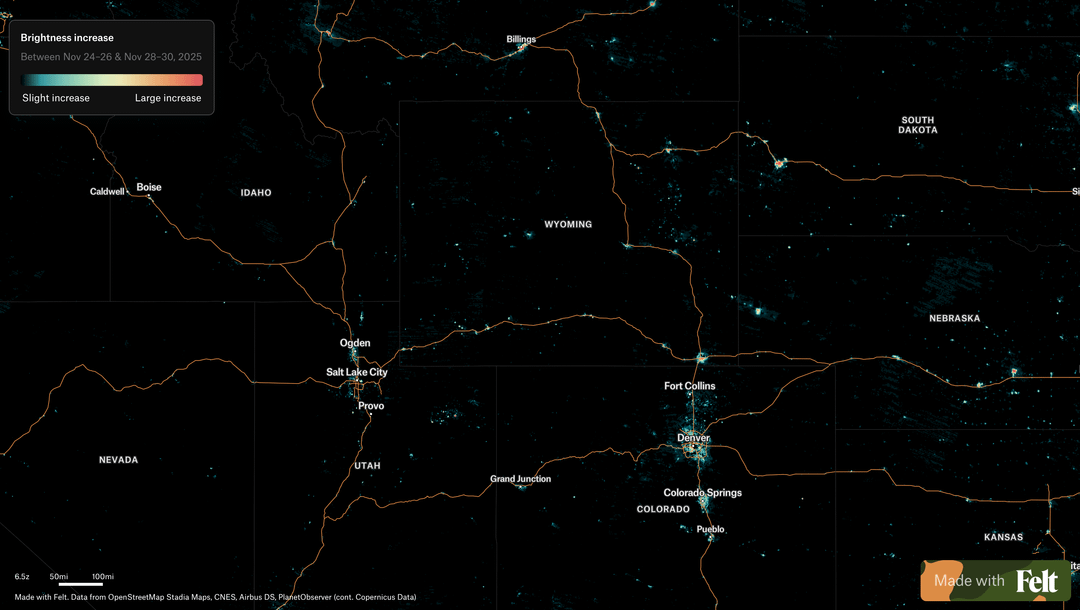
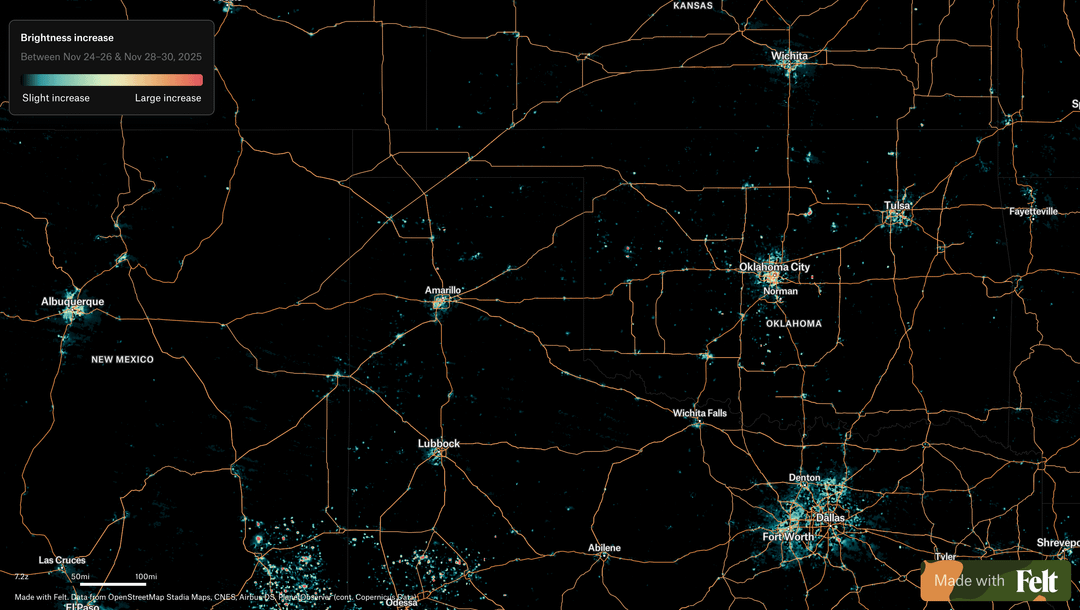
This map compares averaged nighttime brightness before Thanksgiving (Nov 24th – 26th) to averaged brightness a few days after (Nov 28th – Nov 30th).
**Each location is compared to itself over time**, so permanent city lighting fades into the background and locations that increased in brightness are highlighted rather than places that are already bright overall.
Not drawing strong conclusions here – mostly curious what spatial patterns or regional differences people notice when they zoom in! Could the increase be tied to a mix of holiday decorations and Thanksgiving weekend activity even Black Friday?
This sort of thing is always so fun to do. The map is great.
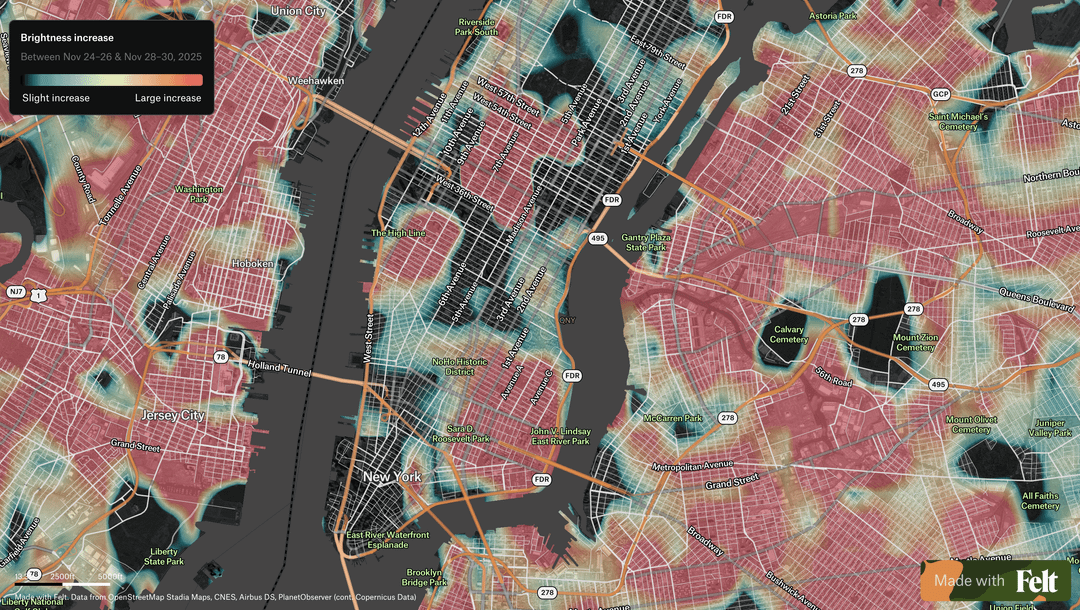
But I wouldn’t connect this to holiday festivities. If you’re using standard VIIRS DNB data, the increase and amplification is most likely due to the [phase of the moon](https://www.spaceweatherlive.com/en/moon-phases-calendar/2025/11.html) and increased lunar brightness between those dates.
To analyze true changes in lighting on the ground, you need to use BRDF (Bidirectional Reflectance Distribution Function) corrected data, which will account for cloud cover, lunar changes, snow cover, air glow in the atmosphere, and other environmental factors that influence the perceived brightness detected by VIIRS. The DNB sensors are *ultra* sensitive: they can detect starlight twinkling on snow.


4 Comments
Do you put your holiday lights up right after Thanksgiving?
This map compares averaged nighttime brightness before Thanksgiving (Nov 24th – 26th) to averaged brightness a few days after (Nov 28th – Nov 30th).
**Each location is compared to itself over time**, so permanent city lighting fades into the background and locations that increased in brightness are highlighted rather than places that are already bright overall.
Not drawing strong conclusions here – mostly curious what spatial patterns or regional differences people notice when they zoom in! Could the increase be tied to a mix of holiday decorations and Thanksgiving weekend activity even Black Friday?
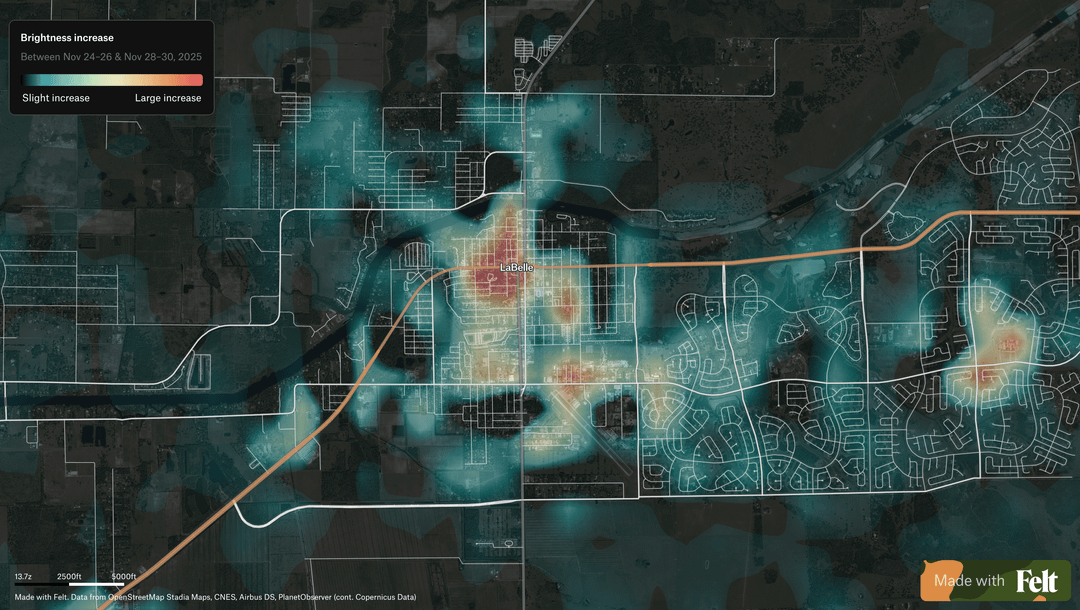
**Map link: try zooming in to see the imagery and evaluate an area you are familiar with**
[https://felt.com/map/Lights-up-XpwkrPrLQNSR9B4oJPlNTiD?loc=36.211,-99.796,5.45z](https://felt.com/map/Lights-up-XpwkrPrLQNSR9B4oJPlNTiD?loc=36.211,-99.796,5.45z)
**Data source:**
NASA VIIRS Day/Night Band
**Tools:**
GDAL and r/Felt
This sort of thing is always so fun to do. The map is great.
But I wouldn’t connect this to holiday festivities. If you’re using standard VIIRS DNB data, the increase and amplification is most likely due to the [phase of the moon](https://www.spaceweatherlive.com/en/moon-phases-calendar/2025/11.html) and increased lunar brightness between those dates.
To analyze true changes in lighting on the ground, you need to use BRDF (Bidirectional Reflectance Distribution Function) corrected data, which will account for cloud cover, lunar changes, snow cover, air glow in the atmosphere, and other environmental factors that influence the perceived brightness detected by VIIRS. The DNB sensors are *ultra* sensitive: they can detect starlight twinkling on snow.
The data product for this is NASA’s [black marble](https://blackmarble.gsfc.nasa.gov) suite of products.
We’ve done this in the [past](https://science.nasa.gov/earth/earth-observatory/even-from-space-holidays-shine-brightly-84897/) for holiday lighting. The algorithms are not trivial, but similar analyses are now much easier thanks to the black marble data.
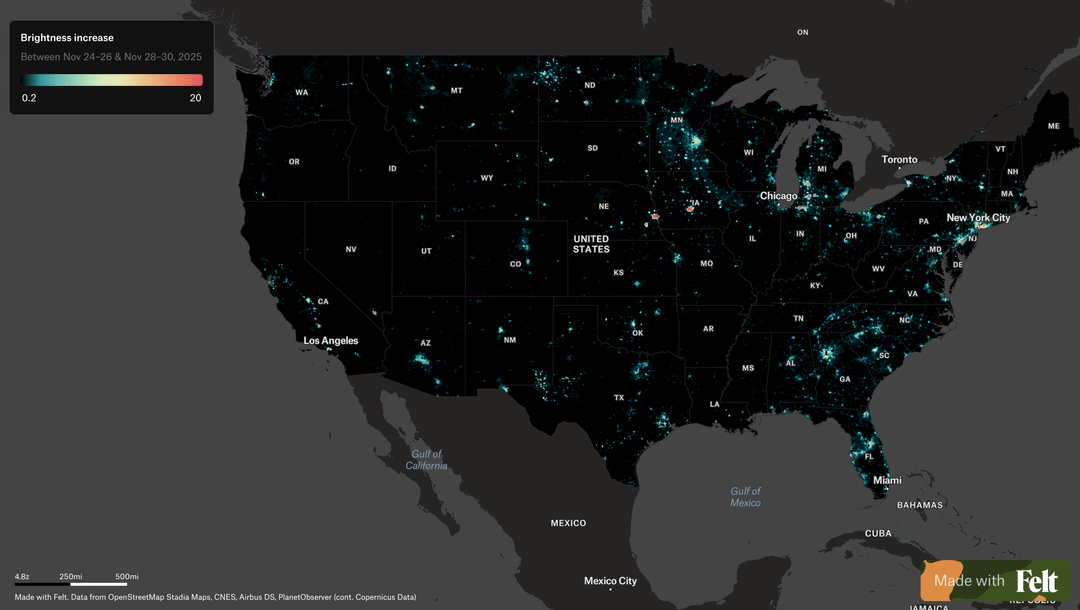
This makes it look like there were exclusively brightness increases across the country. Should have means of dealing with negative changes.
Also, what does “large increase” mean?
Are you sure it’s not snow?