
![[OC] Christmas gift searches on Google](https://www.byteseu.com/wp-content/uploads/2025/12/hb9eux59o49g1-1536x971.png "[OC] Christmas gift searches on Google")
Same procedure as every year? 🎁
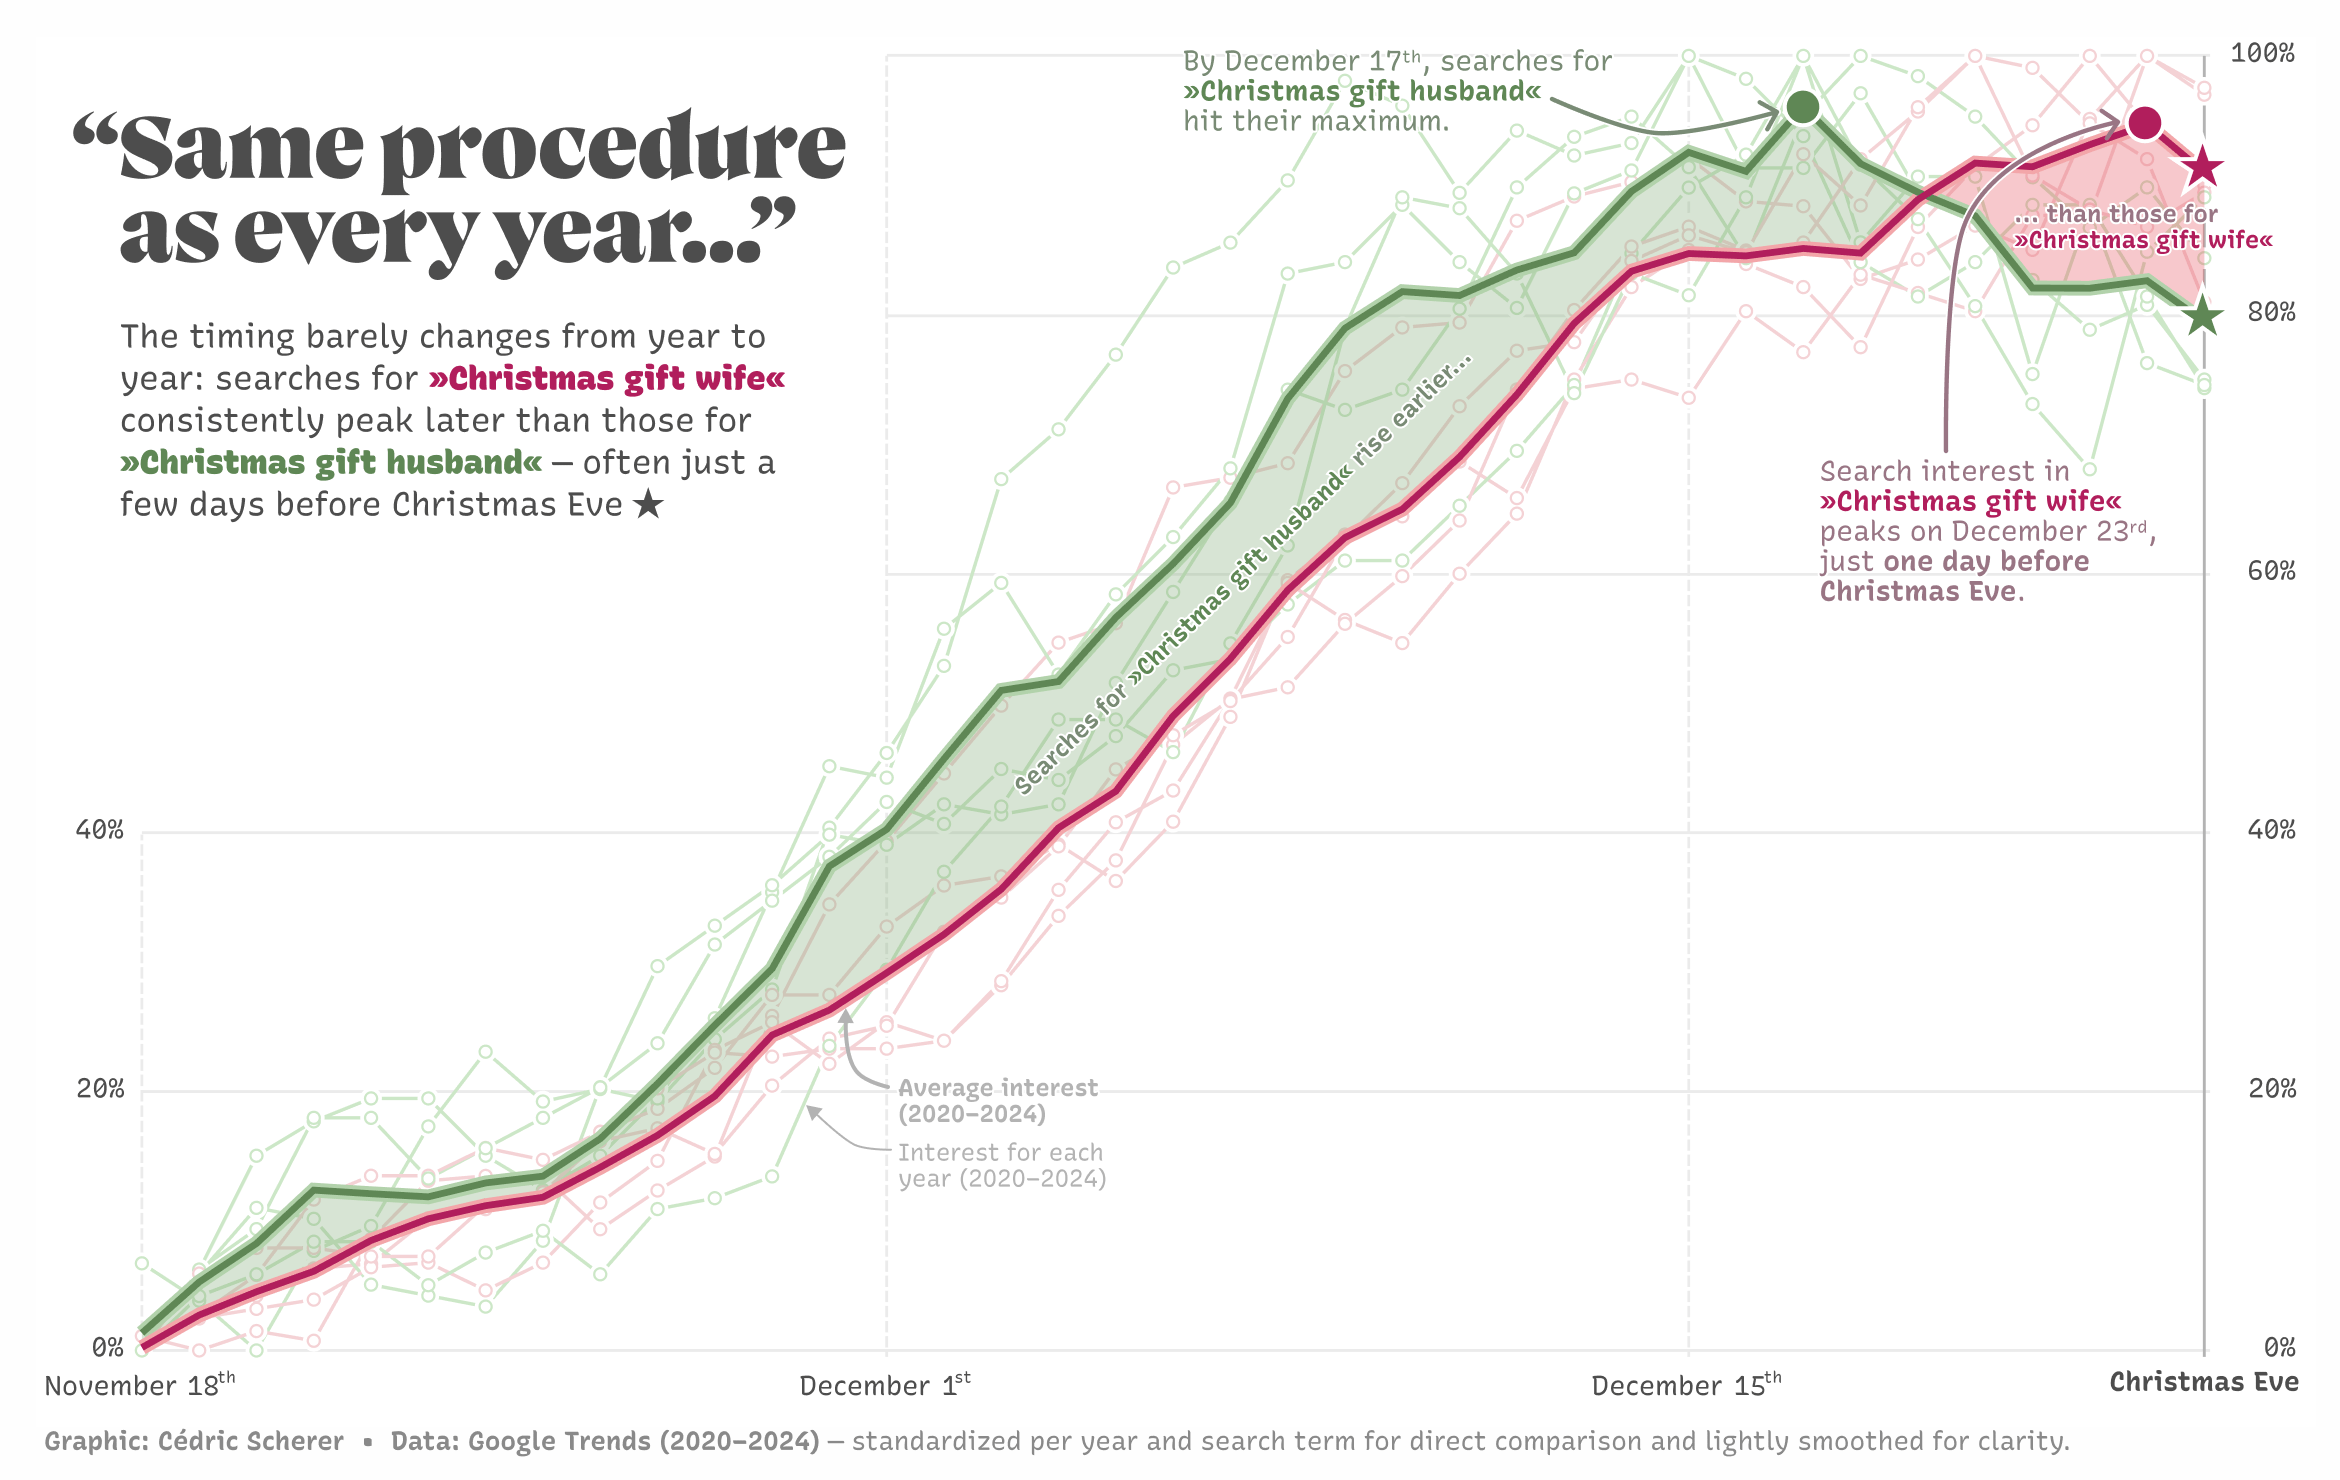
Every December, search behavior follows a stable rhythm. Looking at Google search interest from November 18–December 24 (2020–2024), one pattern keeps repeating:
🎅 “Christmas gift wife” peaks just days before Christmas Eve
🎅 “Christmas gift husband” peaks noticeably earlier
Hope you’ve got all your presents ready by now!
📊 Data: Google Trends, standardized on a yearly basis
🛠️ Made with ggplot2 and Figma
Posted by Z3ttrick
11 Comments
I can’t say I’m surprised
And if you get really lucky the “gift” he buys you is an electric toothbrush that the next day he starts using for himself. So thoughtful 🙄
This reminds me, gotta get my wife a gift !
To some degree its nice to know that most people dont have their shit together
At first glance, I liked your plot but on a second thought I really don’t get it. What’s in the axis? Percent of what? If this is cumulative probability of searches, how can it have a “peak “?
Also, the difference in peak percent to previous or next day is barely 10%. Assuming that’s not just variability without any meaning, what conclusion can one take on these 10%?
Ask yourself: what kind of person searches this query when they look for a gift vs something more personalized and how does that change this statement about men and women?
Is the title a ‘Dinner for one’ reference?
I read a chief data analyst from a major bank in Denmark, made a similar point; there is one day a year when men spend more money in shopping malls compared to women; 23rd december.
Not surprising. Men are more likely to working to the bitter end, and therefore more pre-occupied with work.
These two lines seem pretty well correlated. Some slight difference at the end, but not major.
One year I bought my wife a gift on cyber Monday. Put it in a drawer and completely forgot about it. A few days before Christmas I totally panicked and quick bought her another present. February my wife is like “what is this gift in a drawer for?”