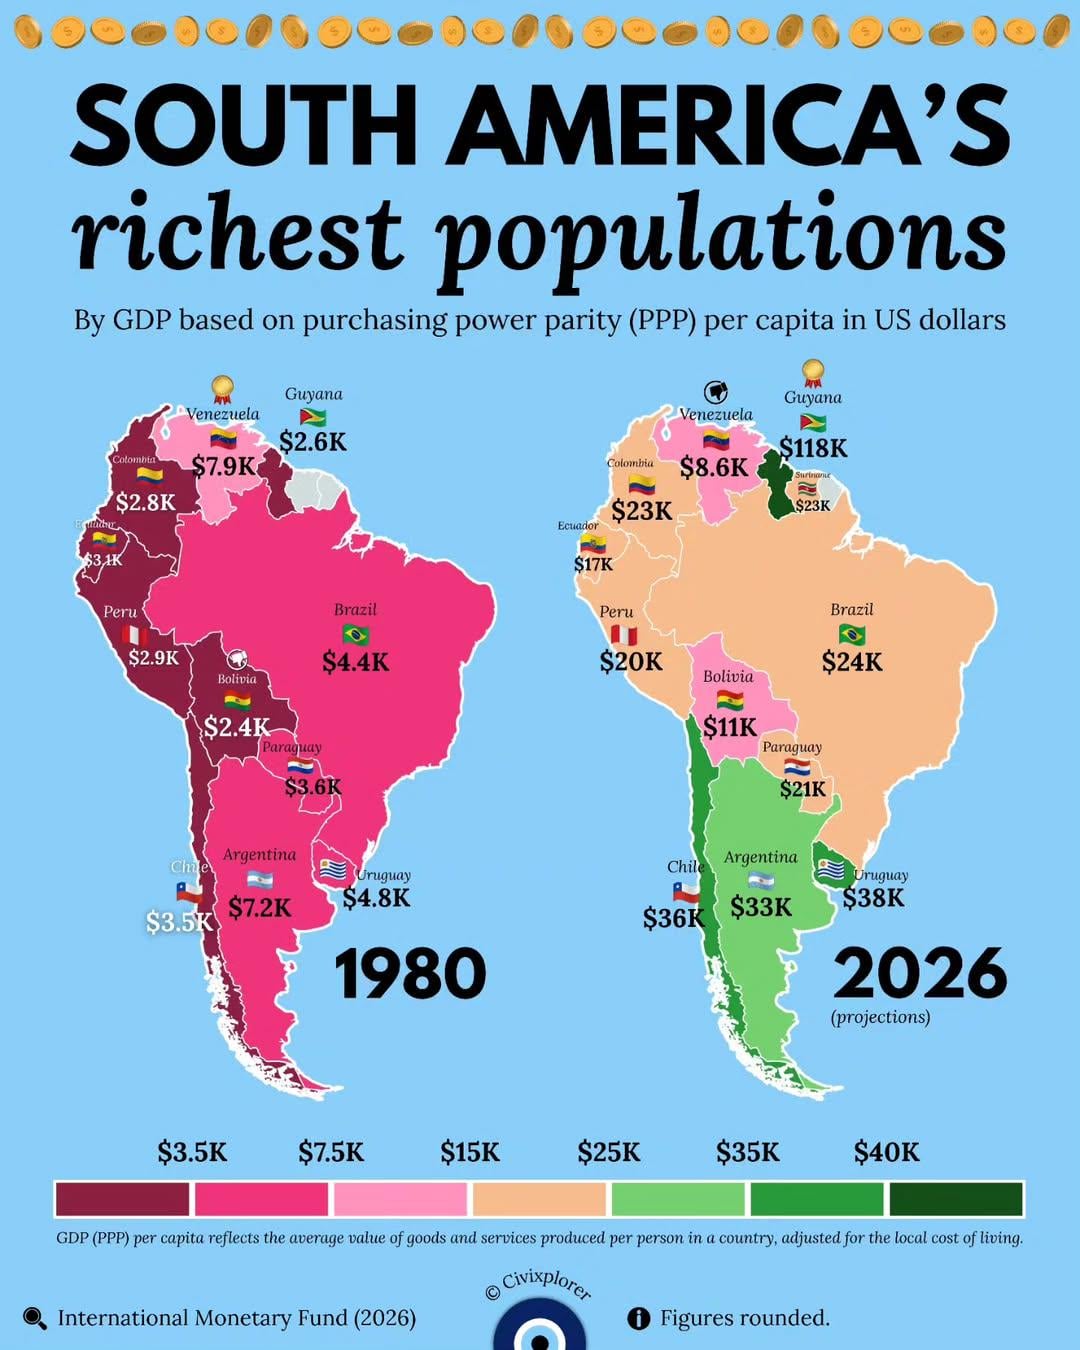
In 1980, Venezuela was a petro-state and the “shining star” of the region, boasting the highest per capita production. However, the lack of diversification, institutional decay and hyperinflation during Chavismo have led to a tragic decline, leaving at the bottom of the rankings by 2026. The fall of Nicolás Maduro and future
LowMany3424 on
Common south cone W
make_sure123 on
Guyana right now:

JeanPaulAndre on
What happened to Guyana ?
oberwolfach on
It always surprises me that Argentina is still quite high in GDP per capita, and not far behind its neighbors Chile and Uruguay, despite the latter two being beacons of sound economic management and Argentina being infamous for the opposite. Of course, it has slipped in relative terms (as the map shows, it was far richer than Chile and Uruguay in 1980, but is now a little behind), but it’s not a catastrophe like Venezuela.
KAnpURByois on
Explain Guyana
ApprehensiveScale868 on
This is a horrific visualisation – the colour coding totally distorts what is actually meaningful.
ulixes1991 on
Found oil in Surinam as well, might be operational in 2028. Potential to be a powerhouse, with preservation of biodiversity. Big IF is corruption
GentlemanSeal on
The color coding is stupid, making it seem like all these countries are 5-10x better off.
Of course, there has been solid development but a lot of the change in values can be attributed to the devaluing of the US dollar and not any increase in wealth or wellbeing.
Catullus13 on
Apparently capitalism doesn’t suck.
Baron_von_Zoldyck on
Brazil is just too big to have data like this making sense in It’s context. The inequality between regions is astounding as the Northeast is heavily populated and quite poor and the southern brazilian cone is also heavily populated but richer, while almost whole argentinian population lives around Buenos Aires and the Rio de la Plata Basin and people in the sparsely populated Patagonia tend to be well off.
Different_Log6947 on
Should be adjusted for inflation
LupusDeusMagnus on
Argentina’s surprising to me because it has a lower GDP and higher population than the state of São Paulo, so it must have a very high PPP multiplier.
I wonder how big is the banding in Brazil, too. Going by 2023, since it’s the last year I have data for Maranhão, Brazil’s poorest state, and applying the Brazilian PPP multiplier of 2.45 as per 2023 IMF, it’d have a GDP PPP per capita of 8.9k, for comparison, in that year Brazil’s was 21.1K, my state of Paraná would be 24K (about 2.6 times higher) and our neighbour to the South was 27K (basically 3 times higher).
cancerinos on
Now if only GDP per capita meant anything in terms of people’s wealth or quality of life…
Anxious_Hall359 on
Phew im glad not to see Aruba’s before and after ahahah. We had Guyana but in reverse
monkeybra1ns on
Btw 48% of Guyana lives in poverty as of 2022 (under $5.50 USD/day). The GDP boom is from oil discovery and Guyana is the second-least populated state in SA, meaning the GDP is divided over a smaller population.
So Venezuela went from the richest to the poorest.
What happened?
FreshPrinceOfH on
Chile has been a real success story.
Worldly-Success-9711 on
Not any more
Known_Salary_4105 on
Absolutely great map.
What would the GDP of Venezuela be if the 8 million productive people who have left were still there, BEING productive?
The question answers itself.
Do not be surprised if two years from now, Argentina is second only to Guyana.
mad_max_999 on
This is the effect of illegal sanctions on a country. Think that in 1980 in Venezuela those money were held by a very few minority of hyper rich people, now at least they’re much better distributed
Psychological_Ad6435 on
Kinda surprised how decent Paraguay is doing considering their assets
Zchavago on
Socialism didn’t work this time for Venezuela. I guess they’ll have to try it again. Maybe someone will finally get it right.
Barn-Alumni-1999 on
Disregarding cocaine, this map *may* be accurate.
guilhermefdias on
Brazil being Brazil, nothing to see here, nothing changes.
Timo-the-hippo on
Yeah Guyana is definitely fake. I know people from there and it’s poor as hell.


29 Comments
In 1980, Venezuela was a petro-state and the “shining star” of the region, boasting the highest per capita production. However, the lack of diversification, institutional decay and hyperinflation during Chavismo have led to a tragic decline, leaving at the bottom of the rankings by 2026. The fall of Nicolás Maduro and future
Common south cone W
Guyana right now:

What happened to Guyana ?
It always surprises me that Argentina is still quite high in GDP per capita, and not far behind its neighbors Chile and Uruguay, despite the latter two being beacons of sound economic management and Argentina being infamous for the opposite. Of course, it has slipped in relative terms (as the map shows, it was far richer than Chile and Uruguay in 1980, but is now a little behind), but it’s not a catastrophe like Venezuela.
Explain Guyana
This is a horrific visualisation – the colour coding totally distorts what is actually meaningful.
Found oil in Surinam as well, might be operational in 2028. Potential to be a powerhouse, with preservation of biodiversity. Big IF is corruption
The color coding is stupid, making it seem like all these countries are 5-10x better off.
Of course, there has been solid development but a lot of the change in values can be attributed to the devaluing of the US dollar and not any increase in wealth or wellbeing.
Apparently capitalism doesn’t suck.
Brazil is just too big to have data like this making sense in It’s context. The inequality between regions is astounding as the Northeast is heavily populated and quite poor and the southern brazilian cone is also heavily populated but richer, while almost whole argentinian population lives around Buenos Aires and the Rio de la Plata Basin and people in the sparsely populated Patagonia tend to be well off.
Should be adjusted for inflation
Argentina’s surprising to me because it has a lower GDP and higher population than the state of São Paulo, so it must have a very high PPP multiplier.
I wonder how big is the banding in Brazil, too. Going by 2023, since it’s the last year I have data for Maranhão, Brazil’s poorest state, and applying the Brazilian PPP multiplier of 2.45 as per 2023 IMF, it’d have a GDP PPP per capita of 8.9k, for comparison, in that year Brazil’s was 21.1K, my state of Paraná would be 24K (about 2.6 times higher) and our neighbour to the South was 27K (basically 3 times higher).
Now if only GDP per capita meant anything in terms of people’s wealth or quality of life…
Phew im glad not to see Aruba’s before and after ahahah. We had Guyana but in reverse
Btw 48% of Guyana lives in poverty as of 2022 (under $5.50 USD/day). The GDP boom is from oil discovery and Guyana is the second-least populated state in SA, meaning the GDP is divided over a smaller population.
https://stevelalla.medium.com/guyanese-are-becoming-poorer-despite-living-in-worlds-fastest-growing-economy-f6f68abb8ca3
So Venezuela went from the richest to the poorest.
What happened?
Chile has been a real success story.
Not any more
Absolutely great map.
What would the GDP of Venezuela be if the 8 million productive people who have left were still there, BEING productive?
The question answers itself.
Do not be surprised if two years from now, Argentina is second only to Guyana.
This is the effect of illegal sanctions on a country. Think that in 1980 in Venezuela those money were held by a very few minority of hyper rich people, now at least they’re much better distributed
Kinda surprised how decent Paraguay is doing considering their assets
Socialism didn’t work this time for Venezuela. I guess they’ll have to try it again. Maybe someone will finally get it right.
Disregarding cocaine, this map *may* be accurate.
Brazil being Brazil, nothing to see here, nothing changes.
Yeah Guyana is definitely fake. I know people from there and it’s poor as hell.
[r/manufacturingconsent](https://www.reddit.com/r/manufacturingconsent/) for imperialist interventionism >>
What socialism does to a mf
What does that even mean, gdp by purchasing power? One shows the economic output, the other how much spending power the population has