
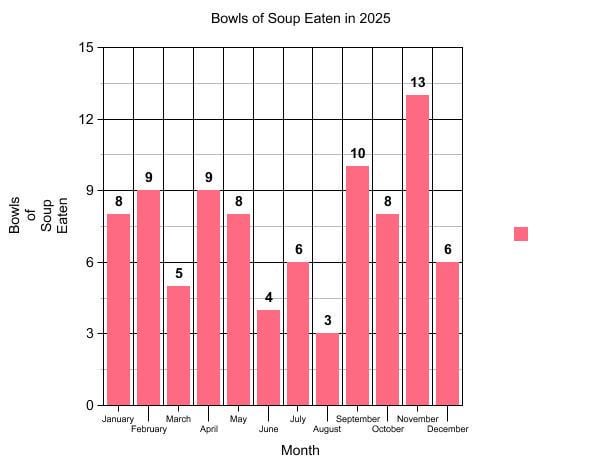
89 bowls of soup in 2025.
This seems to be the most any of my graphs of same food type have deviated from any other graphs of its kind. I suspect it is because of the amount of soup served at work that I eat.
Next year is a pizza year! It'll be the last time I do this. Each food will have 3 different graphs, which I think is plenty to draw from for your data analysis needs of my eating habits. I might also do some analysis of all 15 graphs (17 counting kimchi) I've made over the last 15 years to look for overall trends. See you next year!
Data source: Me
Previous graphs (see top level comments for new links on threads with dead image links)
Bowls and cups of cereal eaten in 2020
OG Sandwiches 2022 thread for posterity and the unmodded sandwiches 2022 thread
Posted by OnIowa
1 Comment
I have a few questions.
You say “eaten”, but there is precedence for soup that can be drank.
How did you define your parameters for soup?
A watery/thin stew?
Gazpacho?
Cereal?
Ramen?
How much liquid do you need to add to paste before it becomes soup?