
![[OC] GPU Transistor Count: 30 Years of Exponential Growth (1995-2025)](https://www.byteseu.com/wp-content/uploads/2026/01/0jillevyipbg1-1024x597.png "[OC] GPU Transistor Count: 30 Years of Exponential Growth (1995-2025)")
Data Source: TechPowerUp GPU Database (via dbgpu Python library)
Tools: Python (pandas, plotly)
GitHub: https://github.com/BryceDonston/gpu-trend-data
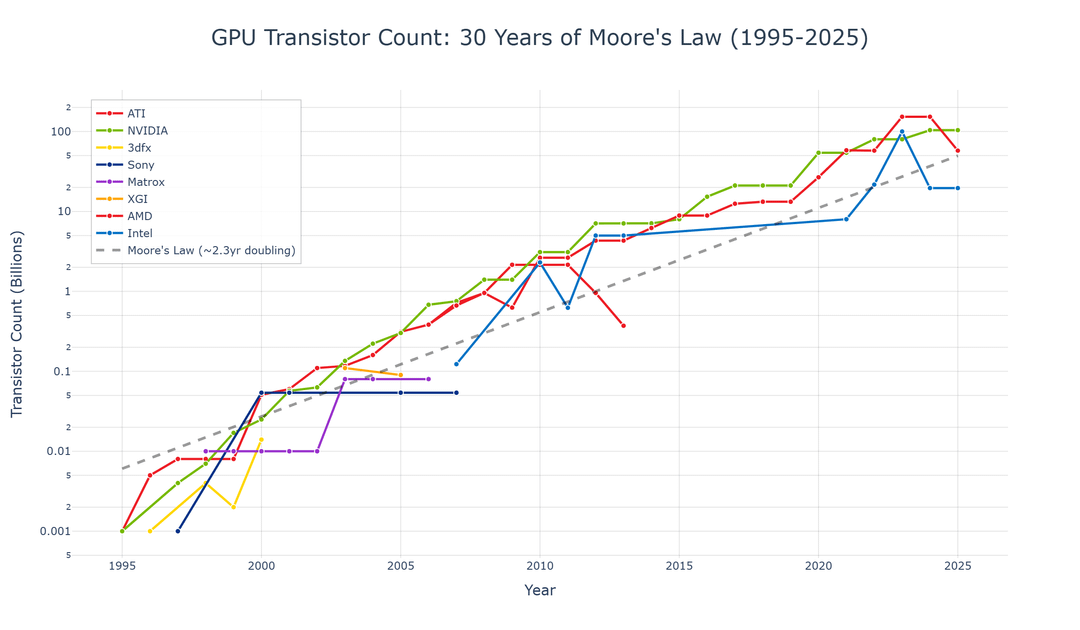
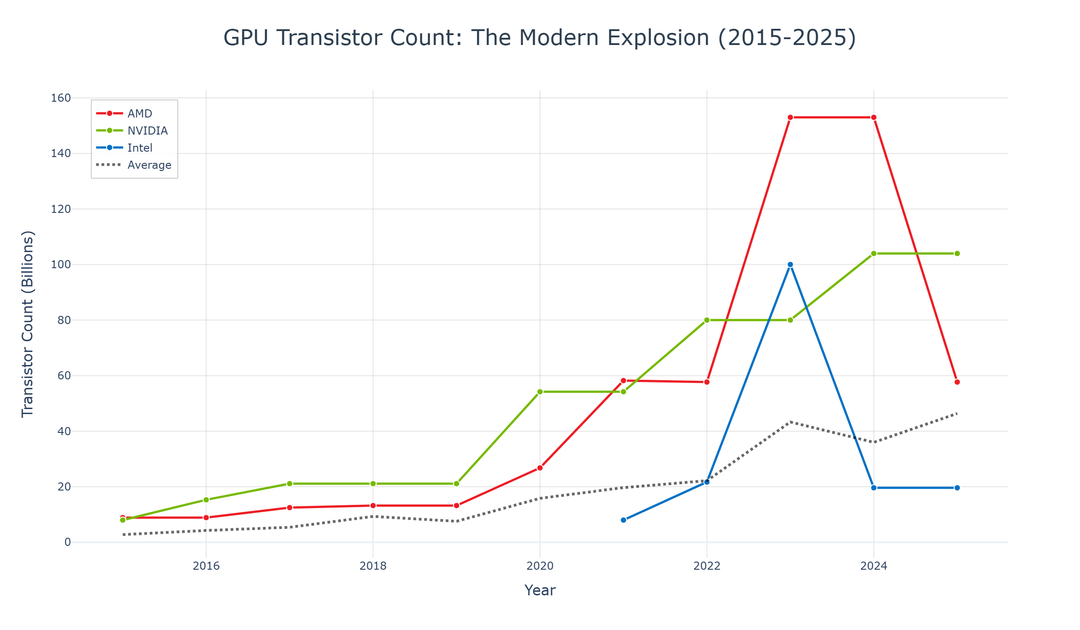
Chart 1 focuses on the modern era (2015-2025) with a linear scale to emphasize
the dramatic explosion in transistor counts. Chart 2 shows the full 30-year
history with a logarithmic scale to visualize Moore's Law progression across
all GPU generations.
Posted by Low_Feed2001