
![[oc] Anyone else tracking the weather?](https://www.byteseu.com/wp-content/uploads/2026/01/quk8tqvozsbg1-1536x930.jpeg "[oc] Anyone else tracking the weather?")
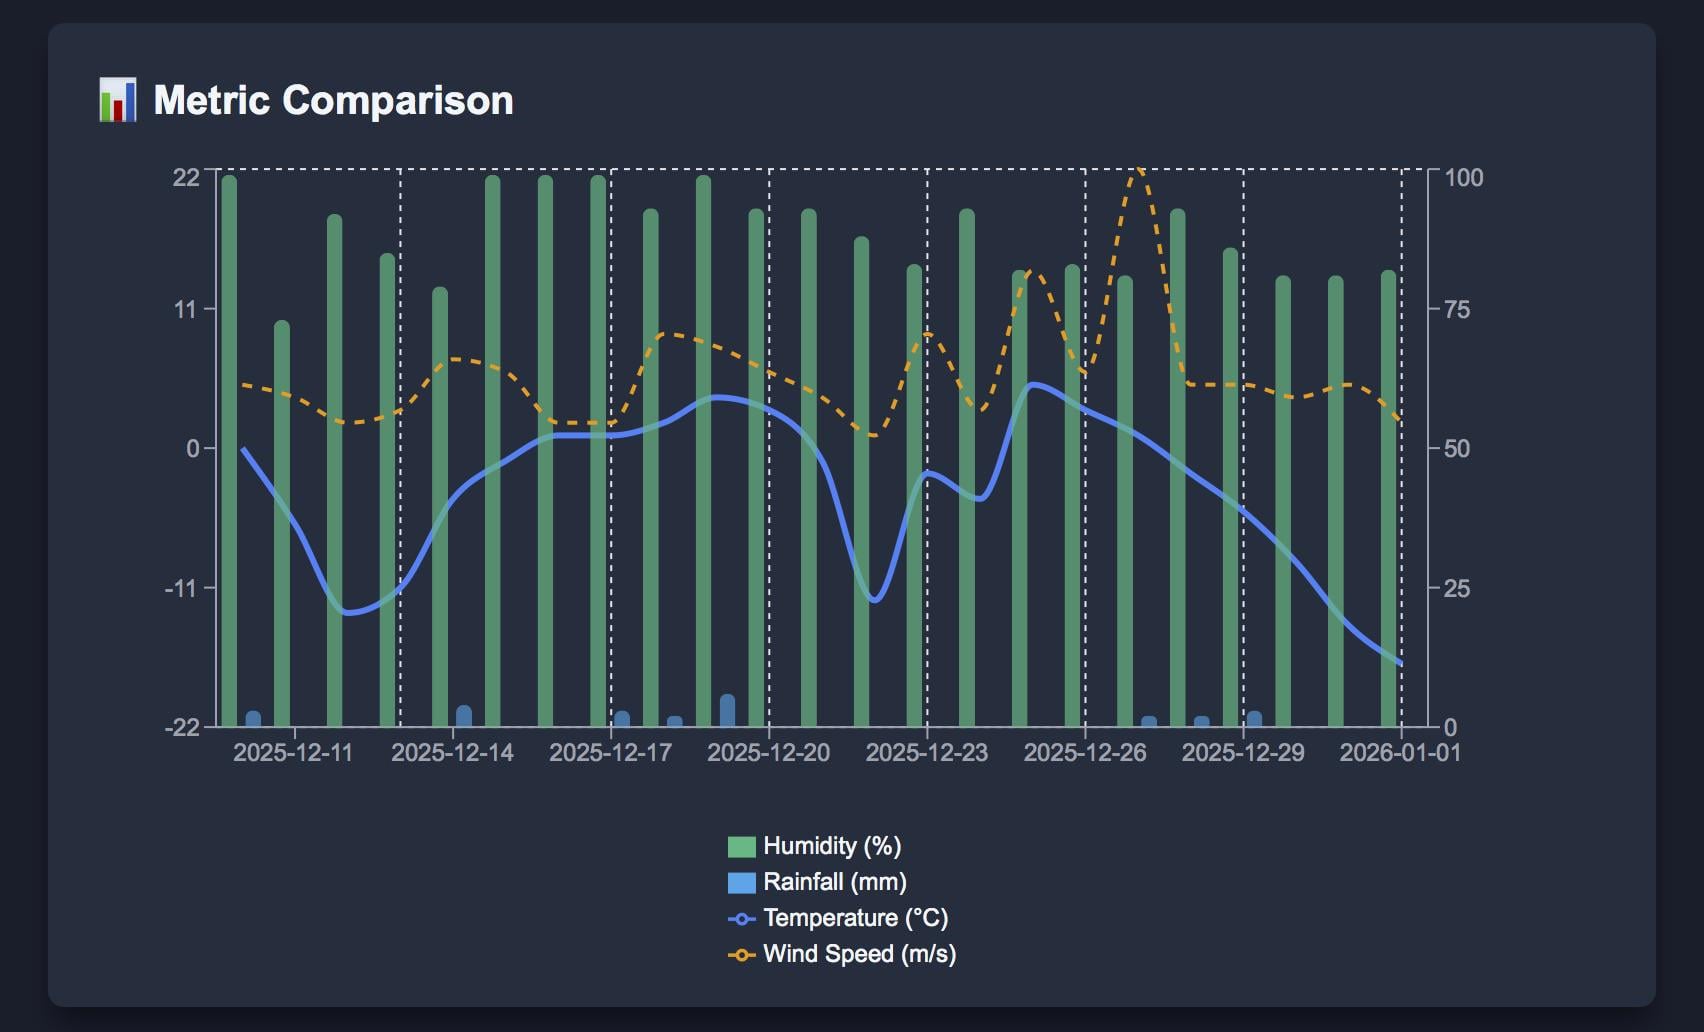
I built a simple app to track this because I wanted to see patterns over time. The chart shows humidity, rainfall, temperature, and wind speed.
I've been tracking daily weather conditions for the past 3 weeks and the data is fascinating. Temperature swung from -17°C to +5°C, that's an 23-degree range!
P.S. If anyone's interested, please check it out:
https://www.facebook.com/share/14RpU3c4Pdc/?mibextid=wwXIfr
https://app.weatherdiary.net/en
Posted by Appropriate-Town826
5 Comments
You’re the only one tracking the weather
I don’t know if anyone else has done this before!
I’ve never known anyone who kept up with the times before, congratulations.
Some feedback for your future charts: is the maximum wind speed 22 m/s or 100 m/s? You need to pair labels with axis, otherwise the reader has to guess. Also, the ranges for humidity and rainfall are way too different to be plot on the same scale.
I love personal time series like this, they get interesting fast once you extend the window. Three weeks already shows volatility, but a rolling average or anomaly vs seasonal baseline would really pop once you hit a few months. I’ve also found humidity plus wind tells a more useful story than temperature alone for perceived swings. Curious if you plan to tag extreme events or just let the raw data speak.