

This is every post from the sub dating back to around 1/2/26, or the max I could fetch using reddit's API (1000) paired down to 530 after filtering out shitposts, non-global maps, etc.
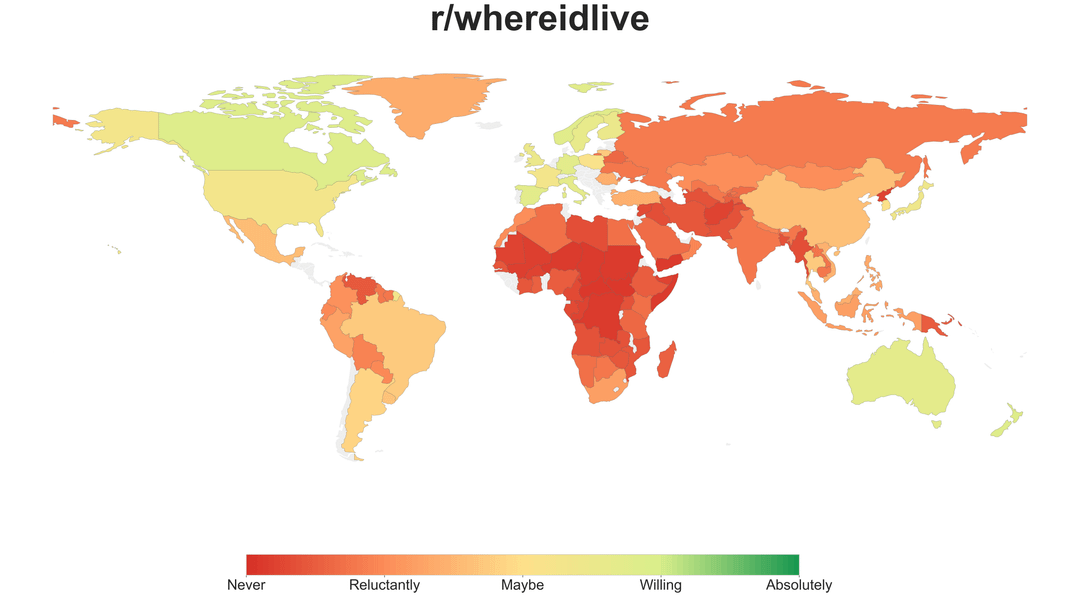
Countries too small to consistently pick out using a computer vision program sadly had to be omitted. They are shown in gray on the map.
Posted by pjpuzzler
17 Comments
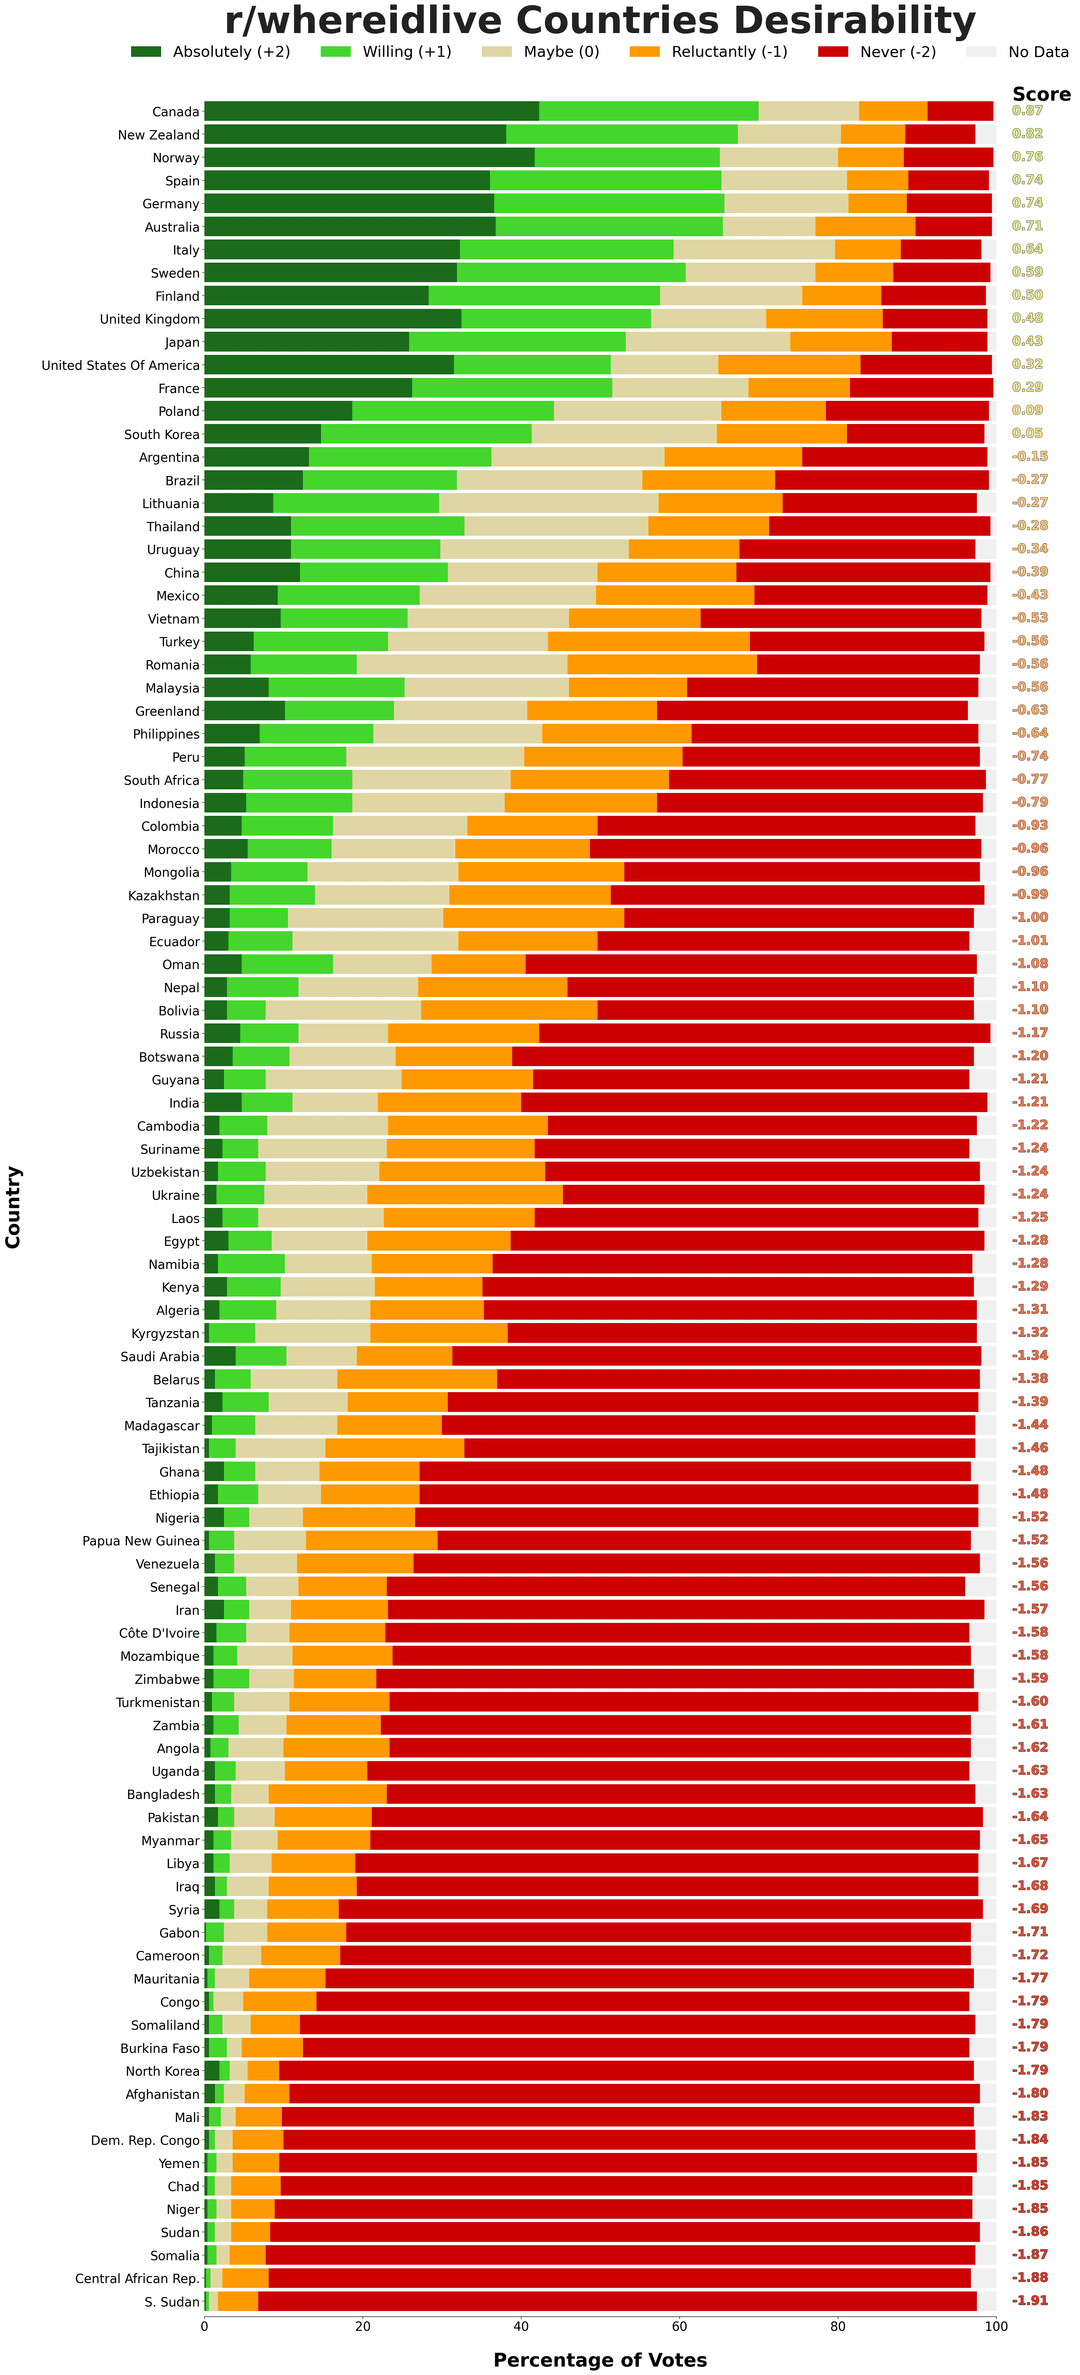
The best thing about living in Canada is that your neighbors are Canadian
Canada is incredible. There’s a lot wrong with it but there are few places I’d rather be.
I’m Canadian and have travelled to a dozen or so countries. Seen some nice places, but have yet to travel somewhere I’d rather live than Canada.
I’ve been around the world, visited at least 50 other nations, and even lived abroad on 3 different continents. I chose willingly to come back every time, and I will likely live here for the rest of my life. People here (Canada) are ignorant of how good they have it compared to the vast majority of the world
I don’t agree with this list. Singapore and Malaysia are really nice places.
Alright, but seriously…omitting Switzerland cannot be handwaved away and exposes a methodological flaw. Its my numero uno.
Developed countries are good to live in? Shocking.
It’s more like a ranking of relations with the United States.
Australia being that high is insane tbh.
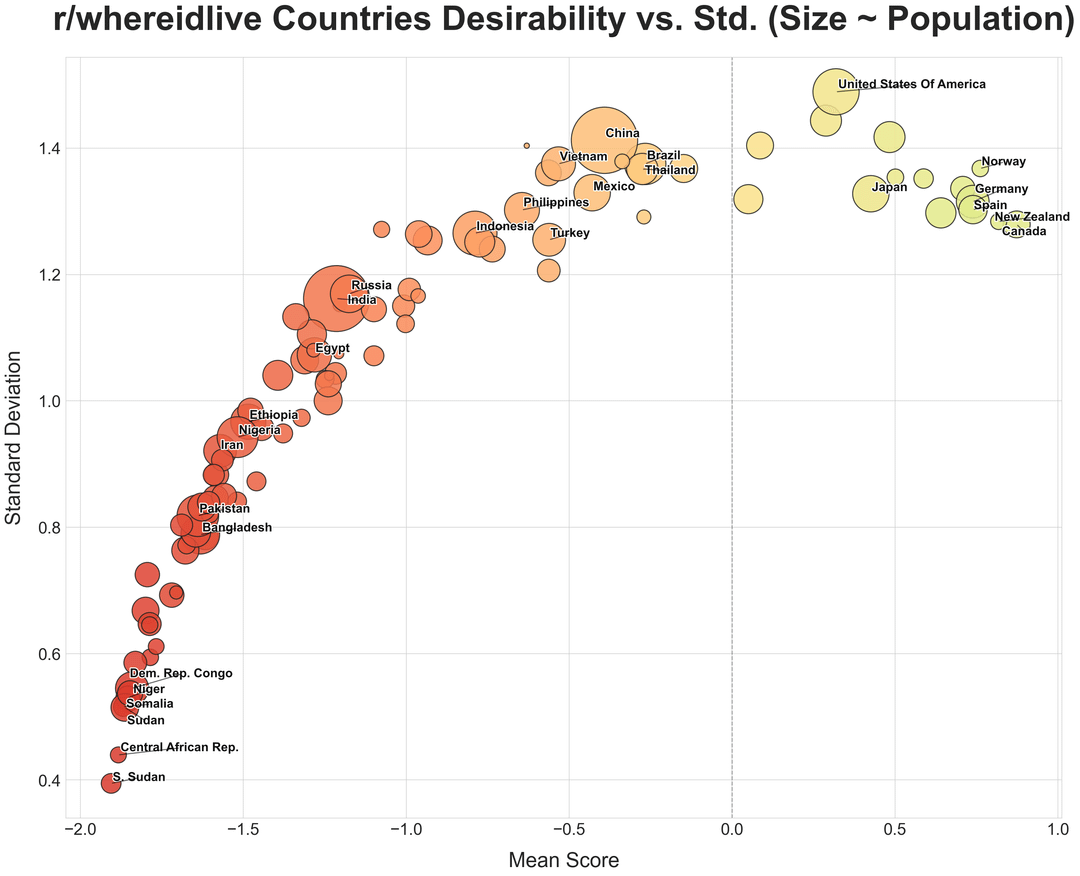
Would be interesting to map vs GDP per capita, probably a high correlation.
I love these posts where people are always all about NZ. Not realising that NZ has net negative migration by a significant proportional margin, because it is not, indeed, hobbiton, and is in fact an extremely isolated and sparsely populated island nation with very few career opportunities, kinda shit weather, super high costs of living, poor housing and public transport infrastructure, and an inept and corrupt right wing government.
I like how you can see a noticeably large group of tankies keeping North Korea from being in the bottom 5. Though, to be fair, while still in the ‘never’ category, I would probably rather live there than any of the countries below it.
I’m curious what the reasons people have against the top 5 countries. Would it be due to family, job obligations, or maybe a language barrier?
All of those countries have a lot going for them, so what are the things that make them a Never?
crazy that people, on avg, would rather live in Iran than Iraq.
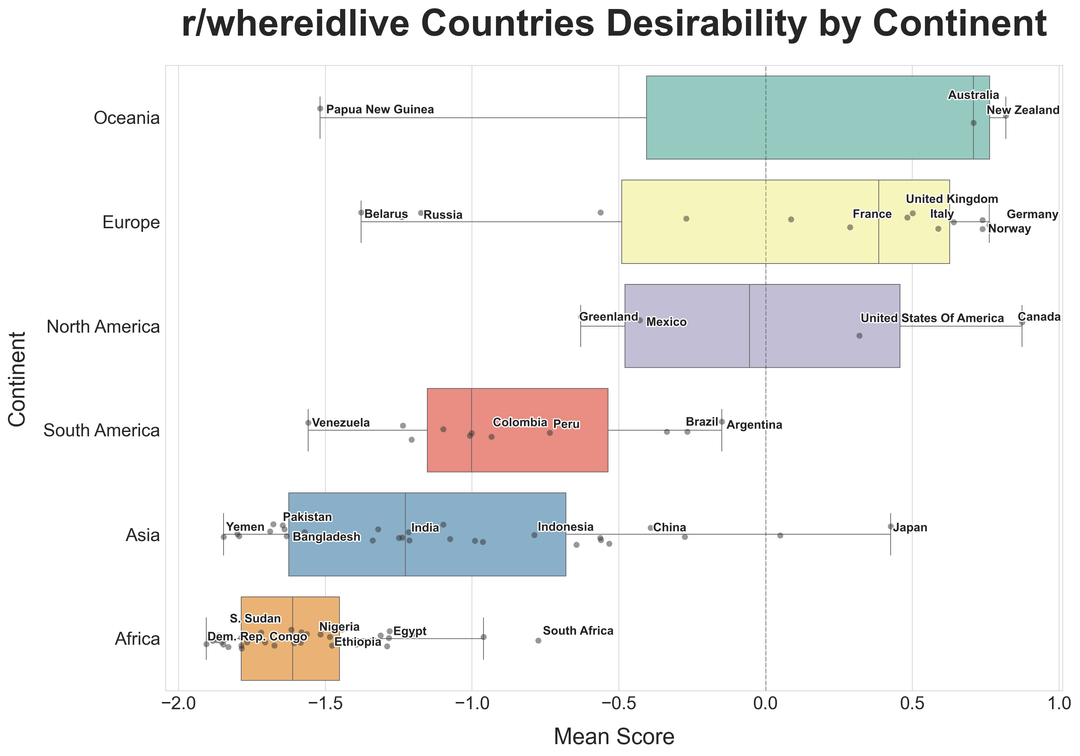
So Greenland is listed as part of N. America now?
Boiled move, cotton!
I’m noticing that all the comments so far are about the topic of the data, and not the way it’s presented. If I’m not mistaken that means you’re doing it right. Congrats!
Please, when formatting the data, consider that red/green colorblindness is the most common form of colorblindness. If the graph is unclear in grayscale, it will be unreadable to the colorblind.