
![U.S. vs. China — The Economic Race (1980–2025)[oc]](https://www.byteseu.com/wp-content/uploads/2026/01/ksm9oujmqucg1-1536x1327.jpeg "U.S. vs. China — The Economic Race (1980–2025)[oc]")
Data Source:
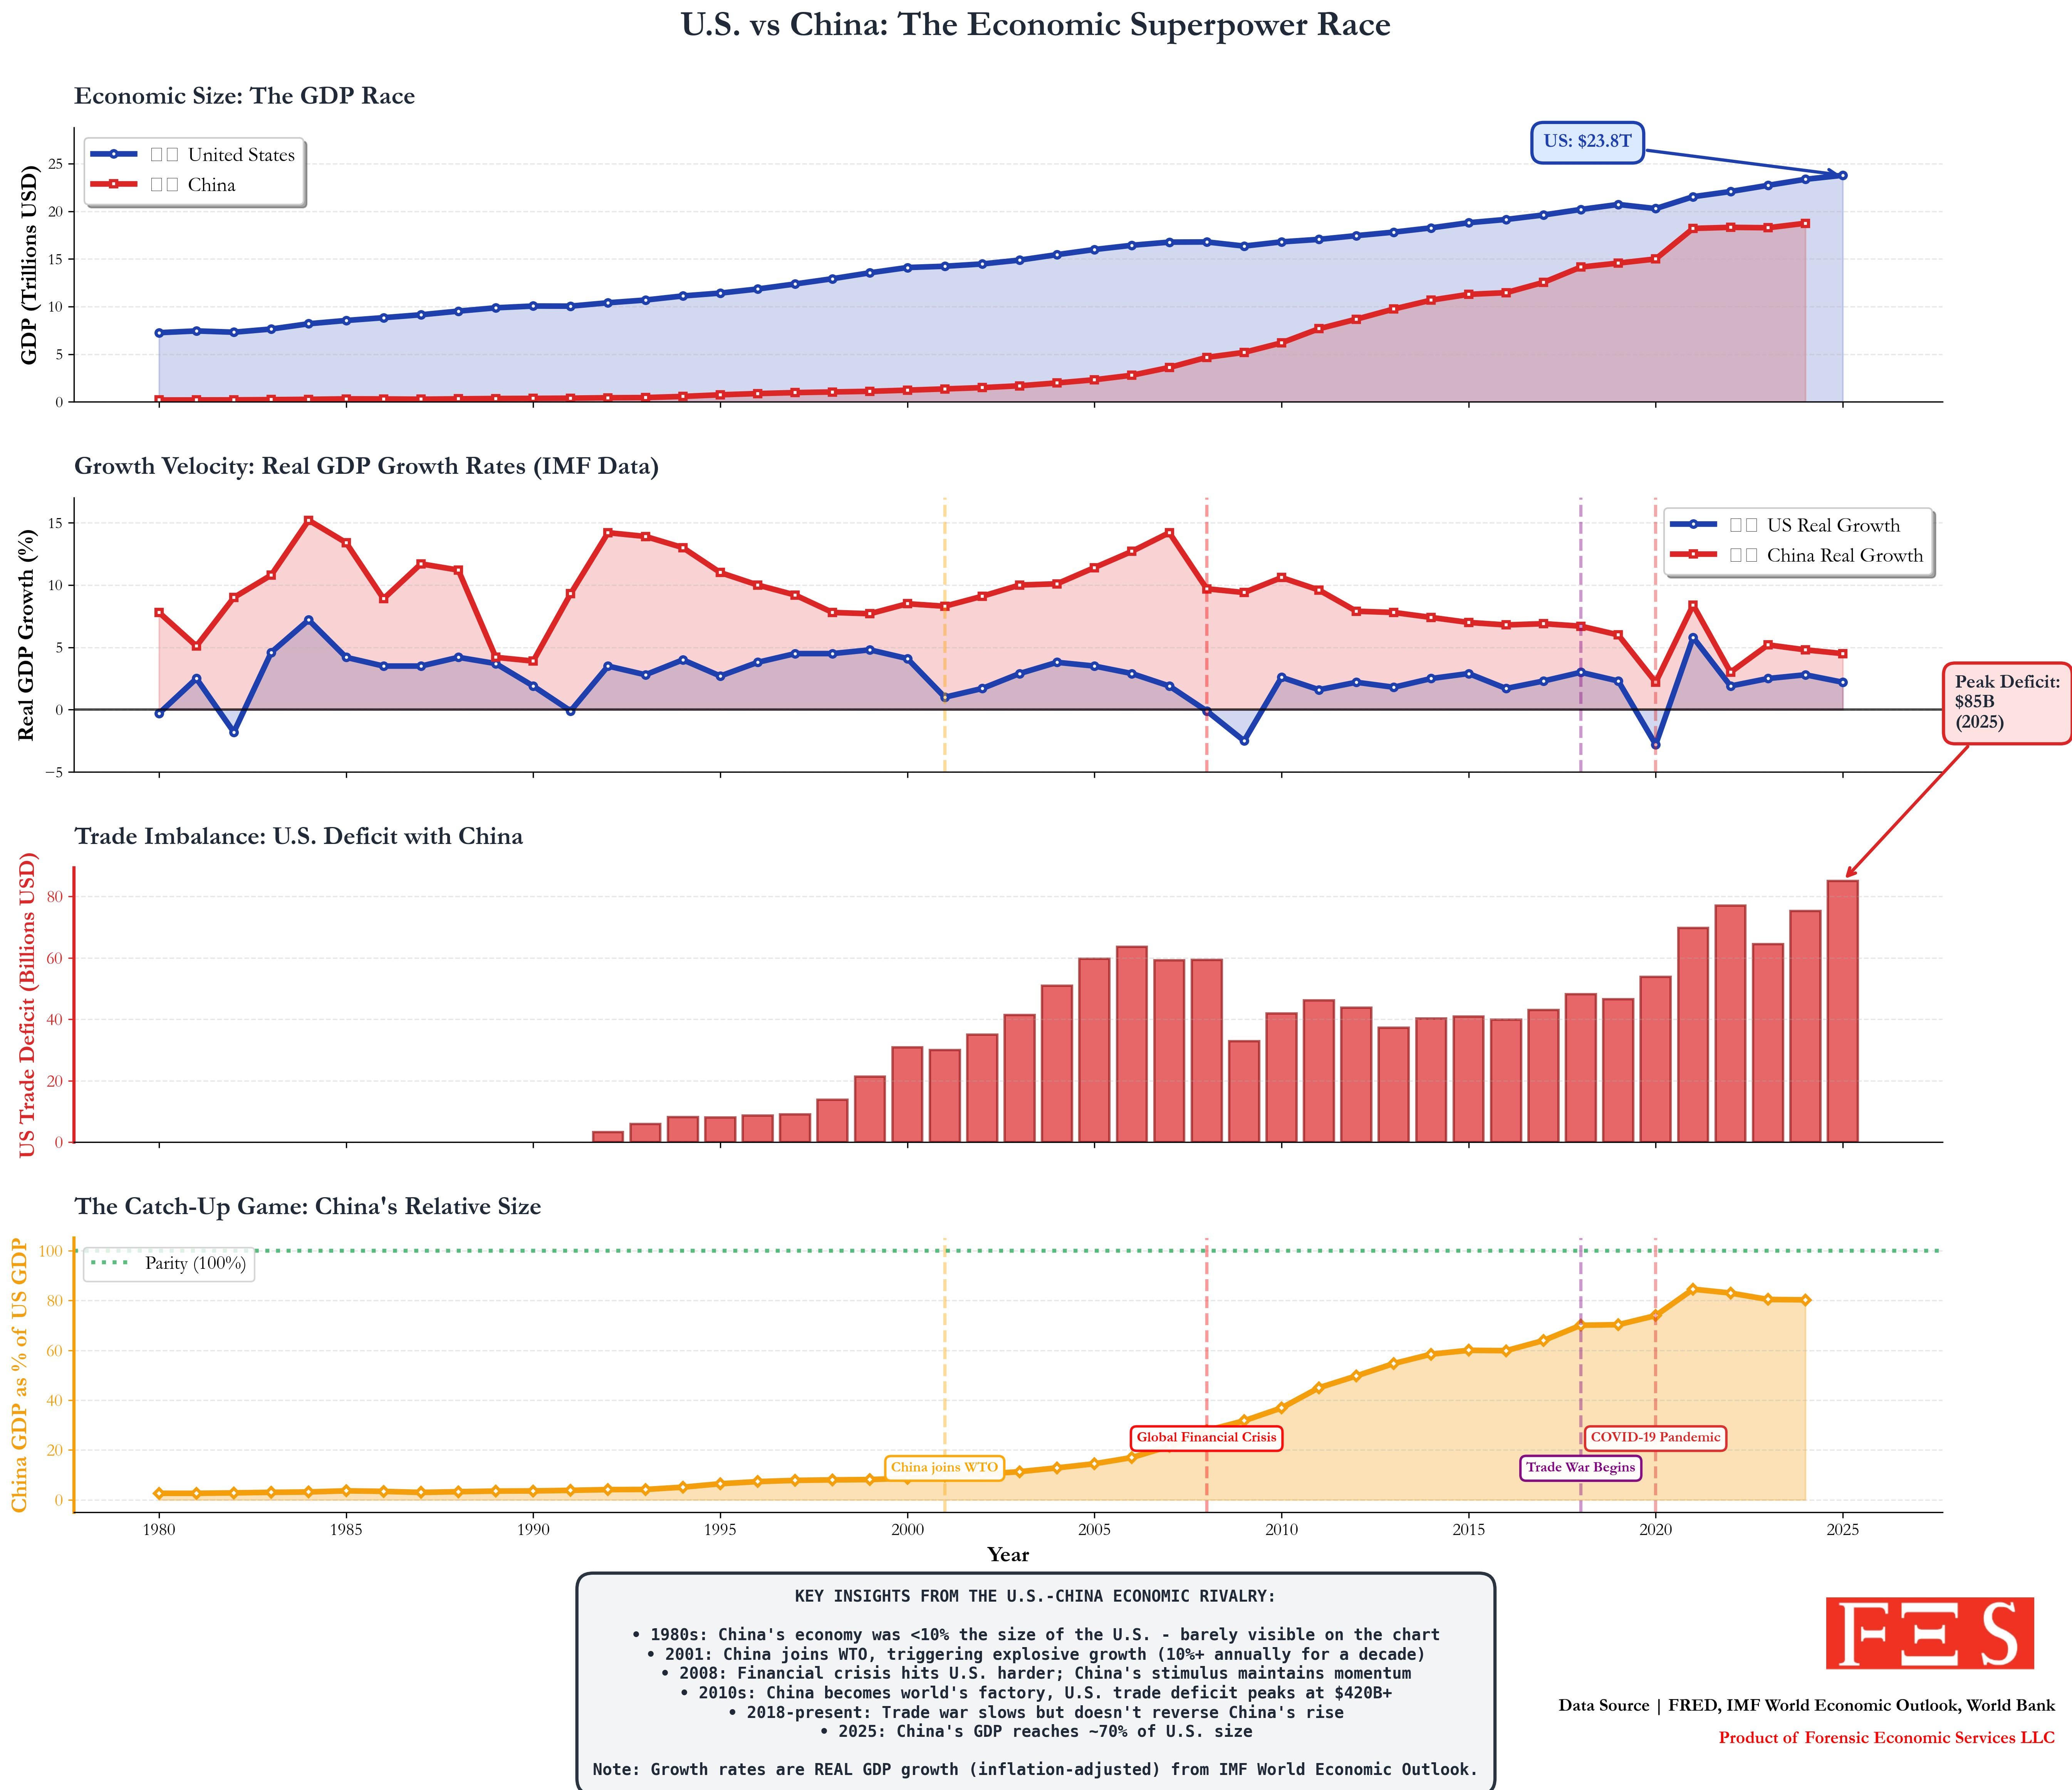
• IMF – World Economic Outlook (GDP levels and real growth rates)

• World Bank – National accounts data

• FRED – U.S. trade deficit with China
Software:
• R GGPlot2
The U.S. and China across four dimensions: nominal GDP levels, real GDP growth rates, U.S. trade deficit with China, and China’s GDP as a share of U.S. GDP. The chart illustrates China’s rapid catch-up since the early 2000s, slower recent growth, and the persistence of a large bilateral trade imbalance.
Posted by forensiceconomics
2 Comments
This isn’t a race it’s a beating.
One timeline (at the bottom) makes it difficult to understand