
-
It’s official: 2025 was the fourth-hottest year on record for the contiguous U.S.
-
The nine warmest years for the U.S. have all occurred since 2012 — part of the ongoing warming trend in the country and across the globe, driven by heat-trapping pollution from burning fossil fuels.
-
Analysis based on Climate Central’s Climate Shift Index found that average 2025 temperatures were made warmer by human-caused climate change in every U.S. county.
-
The U.S. experienced 23 billion-dollar weather and climate disasters in 2025 — including its most costly wildfire and a record number of billion-dollar severe storms.
-
The pollution-fueled climate impacts of 2025 will only intensify with continued fossil fuel use.
STAY TUNED: Tomorrow, January 14, Climate Matters will cover global temperatures in 2025.
This Climate Matters analysis is based on open-access data from the National Oceanic and Atmospheric Administration (NOAA). See Methodology for details.
Download local data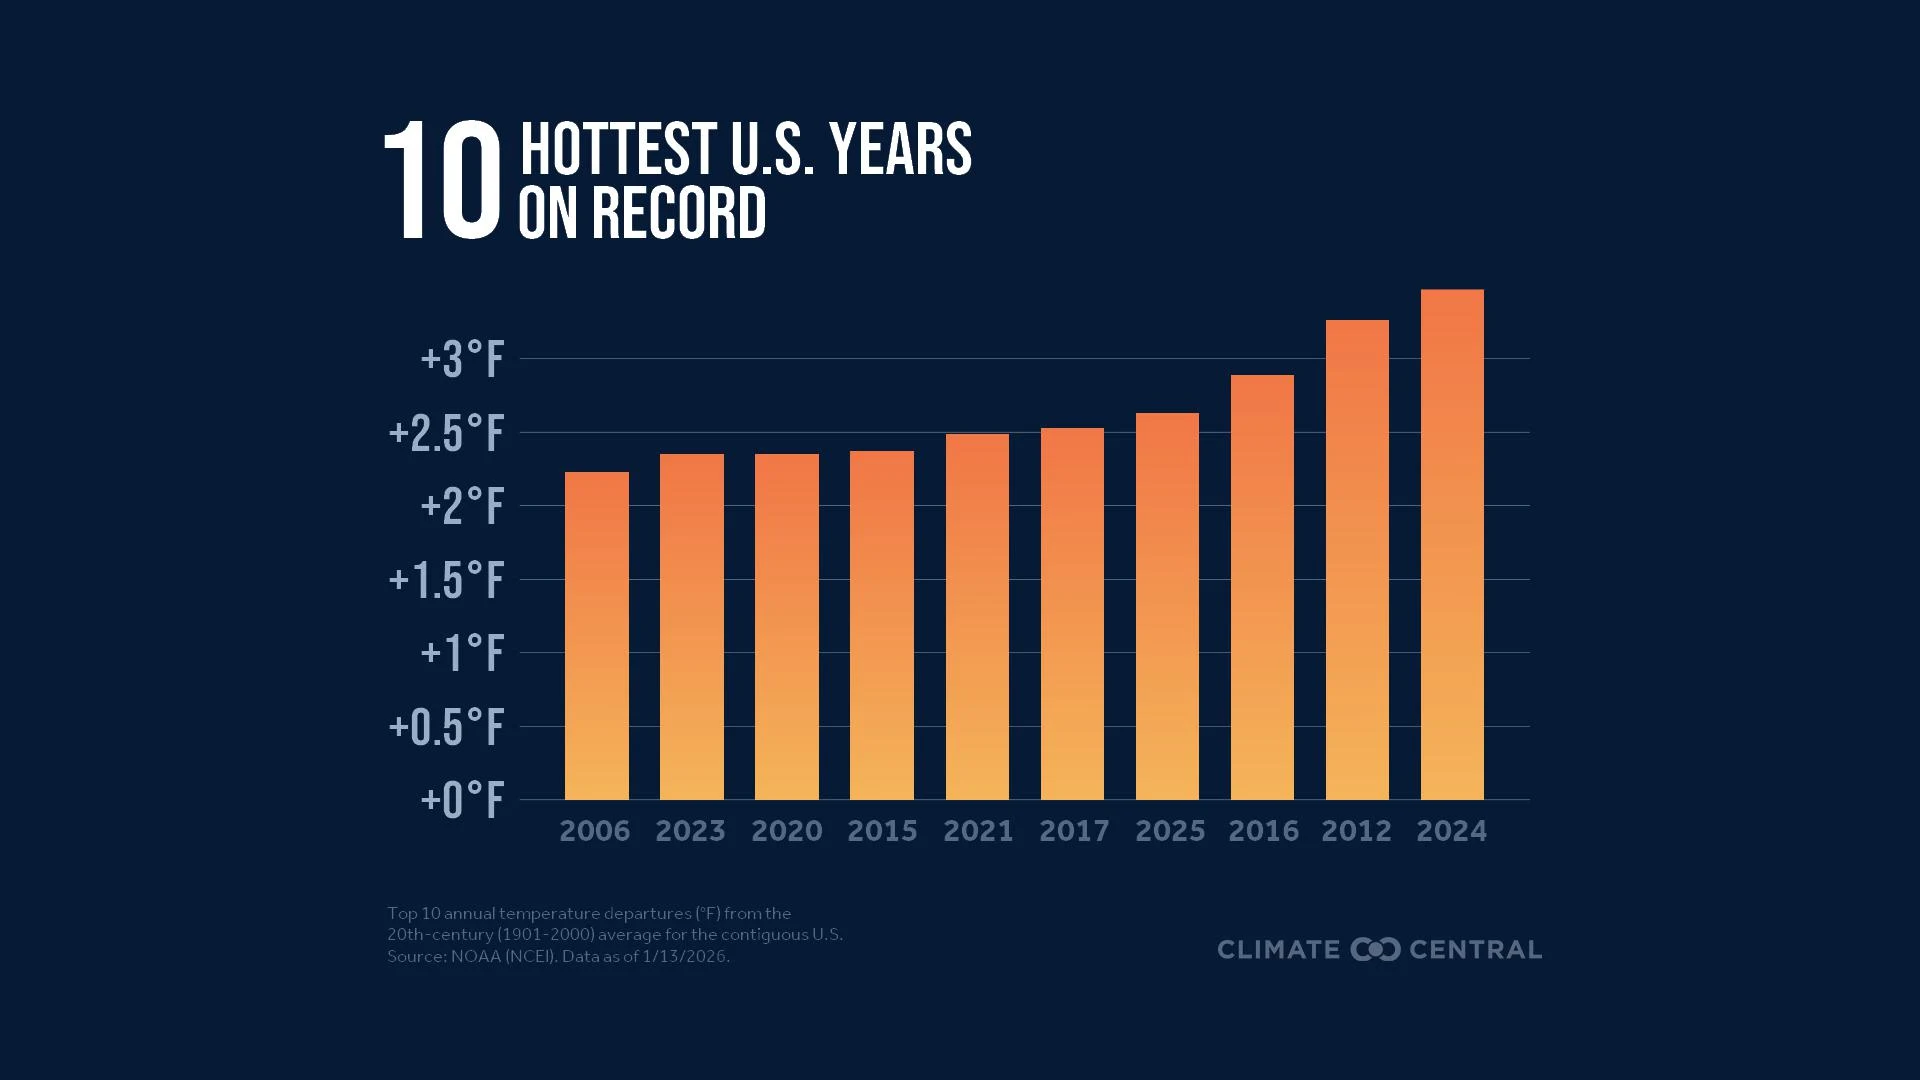 Click the downloadable graphic: Top 10 Warmest US YearsU.S. temperatures in 2025: fourth-warmest year on record
According to the latest NOAA data, 2025 was the fourth-warmest year on record (since 1895) for the contiguous U.S.
Average temperatures for the contiguous U.S. in 2025 were 2.6°F (1.4°C) warmer than the 20th century (1901-2000) average.
The nine warmest years for the U.S. have all occurred since 2012 — part of the rapid global warming trend driven by heat-trapping pollution from burning fossil fuels (coal, oil, and gas).
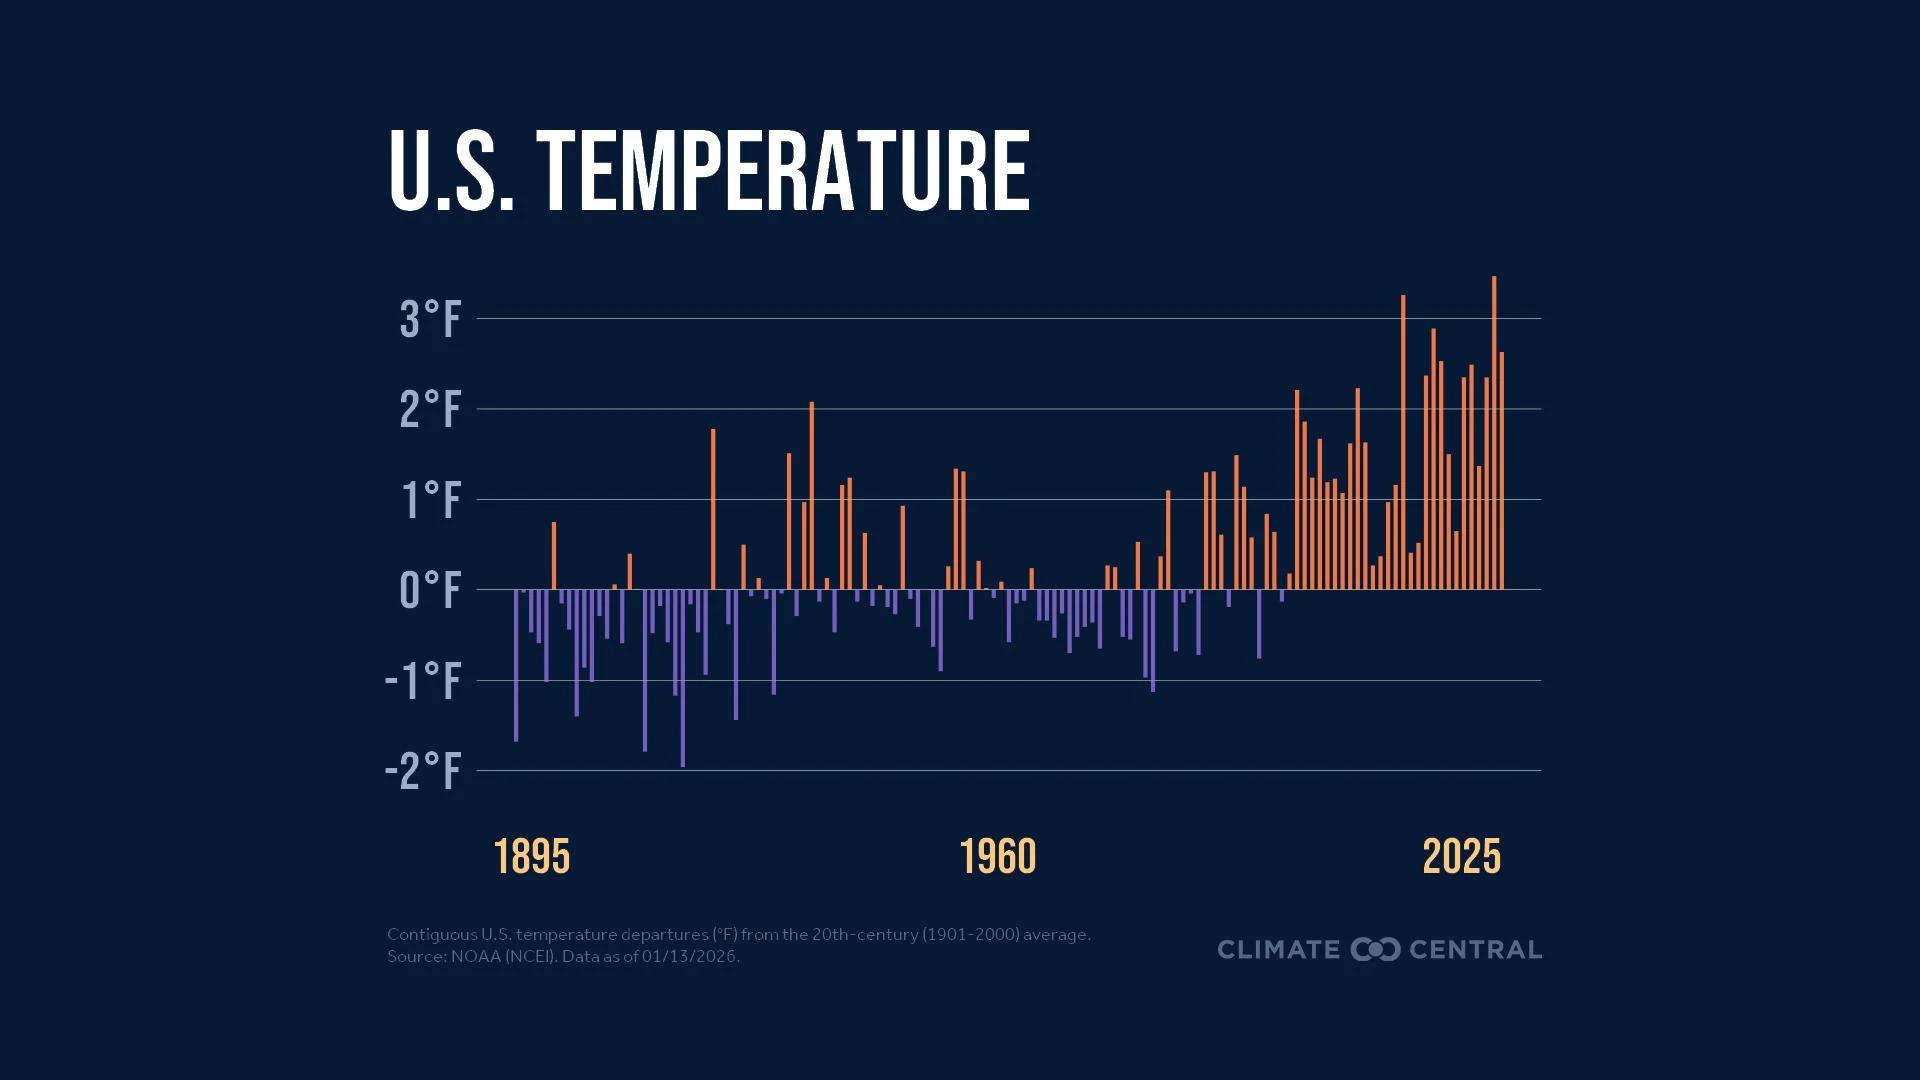 Click the downloadable graphic: U.S. Warming 1895-2025Heat-trapping pollution warmed every U.S. county in 2025
Analysis based on Climate Central’s Climate Shift Index found that average 2025 temperatures were made warmer by human-caused climate change in every U.S. county.
On average across all U.S. counties, 2025 was 2.6°F warmer than it would have been without human-caused climate change.
The influence of climate change on 2025 temperatures was strongest in Alaska and across the southwestern U.S., where some counties saw average annual temperatures that were at least 4°F warmer due to human-caused climate change.
-
Explore the data showing how much carbon pollution influenced 2025’s temperatures in every U.S. county.
In 2025, carbon pollution also made 89% of record high daily temperatures set across 247 major U.S. cities more likely — and influenced risky extreme heat events around the globe.
U.S. billion-dollar disasters in 2025: third-highest year on record
The U.S. experienced 23 billion-dollar weather and climate disasters in 2025. The year ranked third, behind 2023 and 2024, for the annual number of such events — capping a dramatic rise in disaster frequency since 1980.
This trend is due to both the rise in extreme weather and the growing number of people, homes, and businesses in harm’s way.
Billion-dollar disasters in 2025 were marked by:
-
The devastating Los Angeles wildfires, which caused 31 deaths, destroyed 16,000 homes and businesses, and doubled the previous record for the most costly wildfire.
-
A record number (21) of severe storms causing between $1 billion and $11 billion each in damages.
-
An average of just 10 days between billion-dollar disasters in 2025, compared to 82 days during the 1980s.
Explore Climate Central’s U.S. Billion-Dollar Weather and Climate Disasters database for event summaries and the latest interactive data.
LOCAL STORY ANGLESDid climate change influence unusual warmth in my area today?
Climate Central’s Climate Shift Index (CSI) provides tools, data, custom maps, and local alerts to answer this question in real time. Here are three ways to use the CSI:
-
Use the tools and download free graphics. The Climate Shift Index map shows which parts of the world are experiencing climate change-driven temperatures, every day. Explore the global CSI map for today, tomorrow, and any day in the recent past.
-
Access KML files to create custom CSI maps. Get access using the panel links in the map tool and review the KML reference guide.
-
Get inbox alerts. Sign up here to receive custom email alerts when significant CSI levels are detected in your local area.
CONTACT EXPERTS
To request an interview with a Climate Central scientist about this analysis, please contact Abbie Veitch, aveitch@climatecentral.org.
FIND EXPERTS
Submit a request to SciLine from the American Association for the Advancement of Science or to the Climate Data Concierge from Columbia University. These free services rapidly connect journalists to relevant scientific experts.
Browse maps of climate experts and services at regional NOAA, USDA, and Department of the Interior offices.
Explore databases such as 500 Women Scientists, BIPOC Climate and Energy Justice PhDs, and Diverse Sources to find and amplify diverse expert voices.
Reach out to your State Climate Office or the nearest Land-Grant University to connect with scientists, educators, and extension staff in your local area.
METHODOLOGY
Average annual temperature rankings for the contiguous U.S. are from NOAA/NCEI Climate at a Glance.
To assess the influence on human-caused climate change on average annual temperatures in 2025 at the local level, we compared the difference between the 2025 average annual observed temperature (using ECMWF ERA5 reanalysis temperature data) and the 2025 average annual counterfactual temperature for each county in the U.S. Counterfactual temperatures, or the temperatures that would have occurred in a world without human-induced climate change, are estimated using Climate Central’s Climate Shift Index (CSI) system. County-level observed and counterfactual temperatures are area-weighted averages of each grid cell within county boundaries.
All billion-dollar disaster cost estimates included in this Climate Matters are adjusted for inflation (CPI-adjusted). For a full methodology: https://www.climatecentral.org/climate-services/billion-dollar-disasters/references.
Read the FAQs on Climate Central’s U.S. Billion-Dollar Weather and Climate Disasters database.
U.S. billion-dollar disaster data and analysis for 2025 (including CPI-adjustments) reflects the latest available data as of December 31, 2025. Note: as of January 8, 2026, final data is not yet available for the mid-December 2025 flooding event in Washington state.
Annual updates to the set of weather stations used in Climate Matters as of January 1, 2026: We have removed “Area” from the market names of eight locations: Birmingham, Ala.; Grand Junction, Colo.; Grand Rapids, Mich.; Harrisburg, Pa.; Lincoln, Neb.; Paducah, Ky.; Tampa,Fla.; and Wichita, Kan. There have been no annual updates related to the station list or station data.