
 Valuation After Strong Multi‑Period Share Price Gains")
With no single event driving headlines today, Amkor Technology (AMKR) is drawing attention as investors weigh its recent share performance, current valuation signals and the scale of its outsourced semiconductor packaging and test operations.
See our latest analysis for Amkor Technology.
Recent trading has been choppy, with a 1-day share price return of 1.09% and a 7-day share price return showing a 3.53% decline. This comes alongside a much stronger 30-day and 90-day share price return of 22.14% and 57.24% respectively, while the 1-year total shareholder return of 96.00% and 5-year total shareholder return of 185.23% point to momentum that has rewarded long term holders.
If Amkor’s recent move has you looking beyond one name, this could be a useful moment to scan other high growth tech and AI opportunities via high growth tech and AI stocks.
So with the share price well above the current analyst target and recent returns already strong, should you see Amkor as still offering mispriced upside, or are you looking at a stock where the market is already pricing in future growth?
Price-to-Earnings of 39.5x: Is it justified?
Amkor currently trades on a P/E of 39.5x, which sits below both its peer average of 48.8x and the wider US semiconductor industry average of 42.6x.
The P/E ratio tells you how much investors are paying today for each dollar of earnings, which is especially watched in semiconductor and capital intensive chip related businesses. A lower P/E than peers can sometimes hint that the market is assigning a discount to those earnings, or that expectations are more measured.
For Amkor, the current multiple is described as good value relative to both peer companies and the broader industry group. It also lines up closely with an estimated fair P/E of 40.7x. That fair ratio is only slightly above the current 39.5x, which indicates the market may be pricing the stock near that level under current earnings and sector conditions.
Explore the SWS fair ratio for Amkor Technology
Result: Price-to-Earnings of 39.5x (ABOUT RIGHT)
However, you still need to watch for any slowdown in demand from key semiconductor customers and the risk that current sector enthusiasm cools, which could compress a 39.5x P/E.
Find out about the key risks to this Amkor Technology narrative.
Another View: DCF Signals A Very Different Story
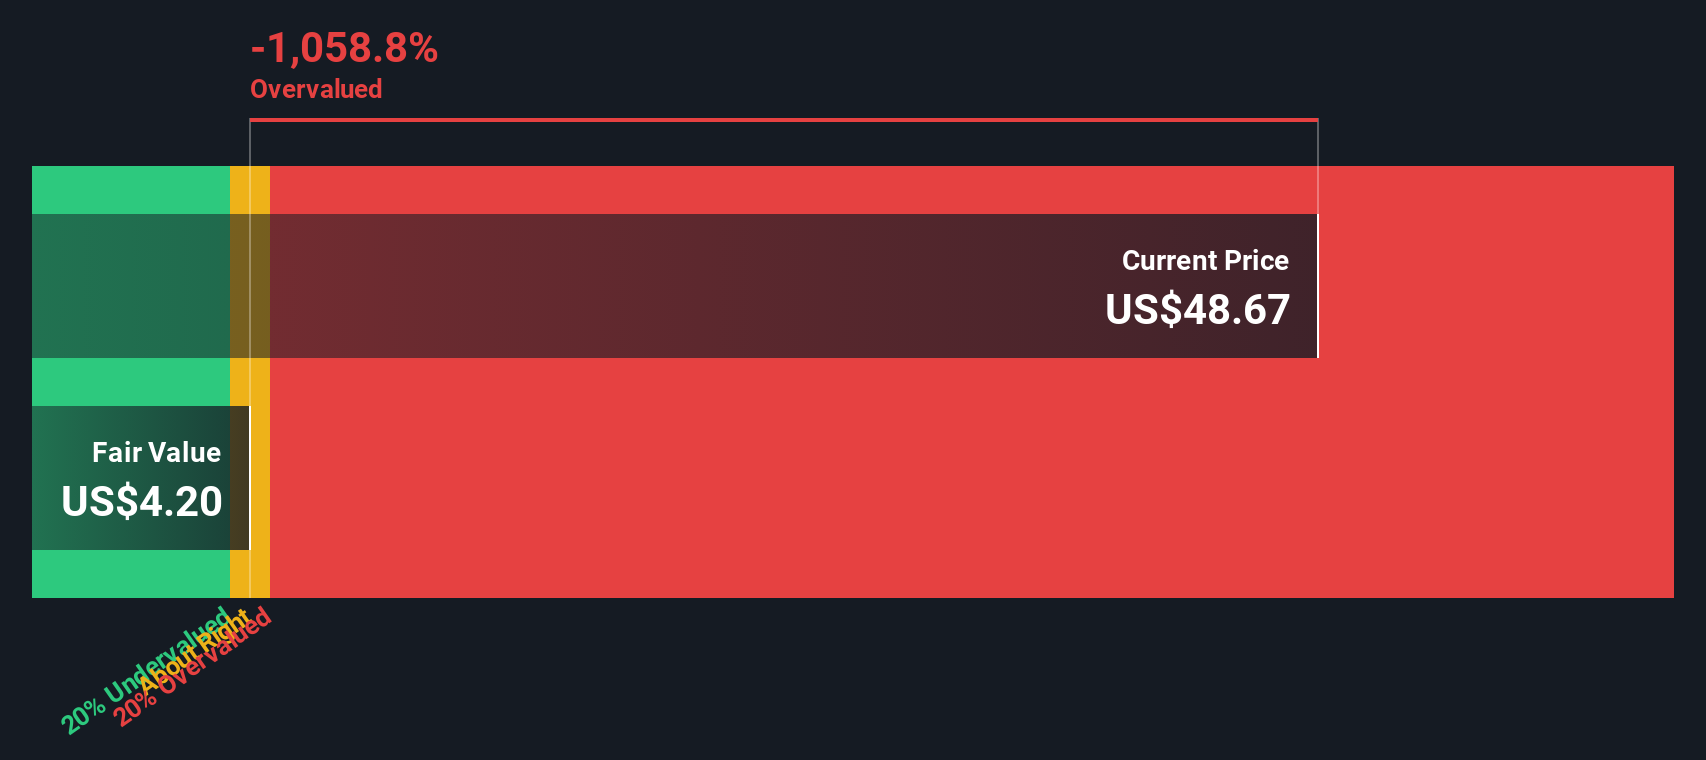
While the P/E comparison paints Amkor as roughly in line with a fair ratio of 40.7x, our DCF model points in the opposite direction. At a share price of US$49.20 versus a fair value estimate of about US$4.20, the model flags the stock as trading well above that implied level. For you, the key question is which framework you trust more for a business like this.
Look into how the SWS DCF model arrives at its fair value.
 AMKR Discounted Cash Flow as at Jan 2026
Simply Wall St performs a discounted cash flow (DCF) on every stock in the world every day (check out Amkor Technology for example). We show the entire calculation in full. You can track the result in your watchlist or portfolio and be alerted when this changes, or use our stock screener to discover 868 undervalued stocks based on their cash flows. If you save a screener we even alert you when new companies match – so you never miss a potential opportunity.
Build Your Own Amkor Technology Narrative
If you see the numbers differently or prefer to rely on your own work, you can pull the same data, stress test your assumptions, and Do it your way in just a few minutes.
A great starting point for your Amkor Technology research is our analysis highlighting 3 key rewards and 1 important warning sign that could impact your investment decision.
Looking for more investment ideas?
If you only stop at Amkor, you could miss other opportunities that fit your style, so take a few minutes to scan broader ideas before you move on.
This article by Simply Wall St is general in nature. We provide commentary based on historical data
and analyst forecasts only using an unbiased methodology and our articles are not intended to be financial advice. It does not constitute a recommendation to buy or sell any stock, and does not take account of your objectives, or your
financial situation. We aim to bring you long-term focused analysis driven by fundamental data.
Note that our analysis may not factor in the latest price-sensitive company announcements or qualitative material.
Simply Wall St has no position in any stocks mentioned.
We’ve created the ultimate portfolio companion for stock investors, and it’s free.
• Connect an unlimited number of Portfolios and see your total in one currency
• Be alerted to new Warning Signs or Risks via email or mobile
• Track the Fair Value of your stocks
Have feedback on this article? Concerned about the content? Get in touch with us directly. Alternatively, email editorial-team@simplywallst.com