
 Valuation After Analyst Upgrades And Earnings Optimism")
Recent analyst moves have put Liberty Energy (LBRT) in focus, with an upgrade from JP Morgan, an A+ EPS Revision rating, and an Outperform consensus shaping expectations ahead of the upcoming earnings release.
See our latest analysis for Liberty Energy.
At a share price of US$20.19, Liberty Energy has seen a 30 day share price return of 18.07% and a 90 day share price return of 31.79%, while its 1 year total shareholder return of 8.59% decline contrasts with a 5 year total shareholder return of 69.59%. This points to stronger long term momentum than its recent pullback suggests.
If Liberty’s recent moves around data center power and AI infrastructure have your attention, this could be a useful moment to widen your search with aerospace and defense stocks.
With the stock sitting around its average analyst target and an indicated 40% intrinsic discount, the key question is whether Liberty is still trading below its fundamentals or if the recent rally already reflects future growth.
Most Popular Narrative: 4.3% Overvalued
Liberty Energy’s widely followed narrative pegs fair value at about US$19.36, slightly below the latest close of US$20.19, which frames the current setup ahead of earnings.
Industry consolidation and increasing requirements for sustainable, digital, and integrated offerings are accelerating the attrition of inferior assets and less-capable providers, favoring Liberty’s technologically advanced fleets and bolstering pricing power and market share over the medium to long term, supporting expanding net margins.
Curious how modest revenue growth, thinner margins, and a much higher future P/E are all wired together into that fair value? The full narrative lays out the earnings path, the implied multiple several years from now, and how those assumptions connect back to today’s price.
Result: Fair Value of $19.36 (OVERVALUED)
Have a read of the narrative in full and understand what’s behind the forecasts.
However, there is still the risk that a softer completions market and delayed power project revenues could leave earnings weaker than this fair value narrative assumes.
Find out about the key risks to this Liberty Energy narrative.
Another Way to Look at Value
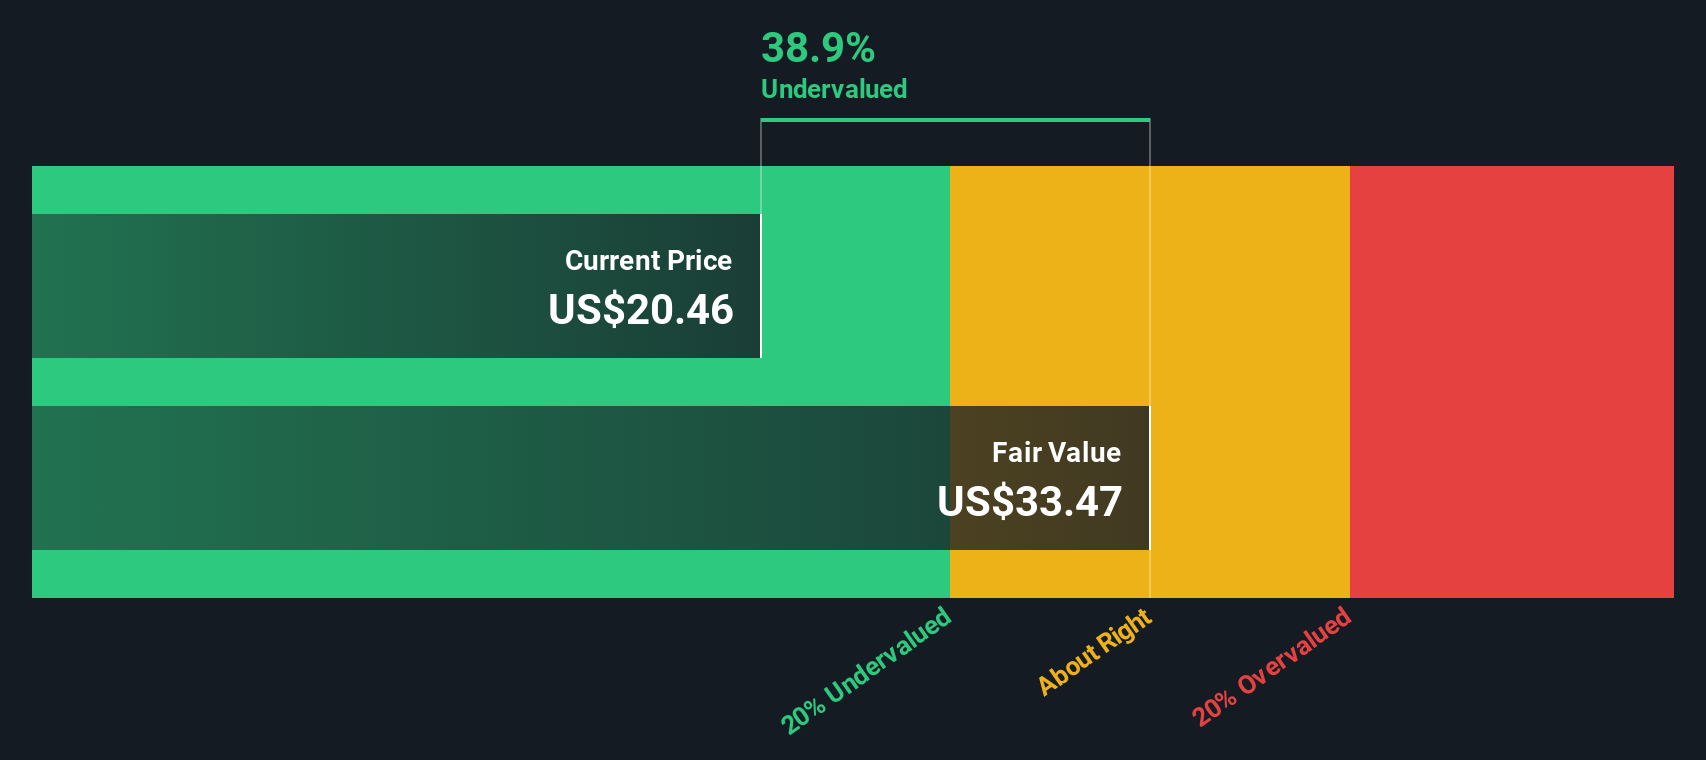
Our DCF model points in a very different direction to the consensus fair value of about US$19.36. On this framework, Liberty Energy at US$20.19 is trading roughly 40% below an estimated fair value of US$33.46, which frames the current price as a discount rather than a premium. With one model flagging overvaluation and another flagging undervaluation, which set of assumptions about future earnings and risk do you find more realistic?
Look into how the SWS DCF model arrives at its fair value.
 LBRT Discounted Cash Flow as at Jan 2026
Simply Wall St performs a discounted cash flow (DCF) on every stock in the world every day (check out Liberty Energy for example). We show the entire calculation in full. You can track the result in your watchlist or portfolio and be alerted when this changes, or use our stock screener to discover 871 undervalued stocks based on their cash flows. If you save a screener we even alert you when new companies match – so you never miss a potential opportunity.
Build Your Own Liberty Energy Narrative
If you look at the numbers and reach a different conclusion, or simply prefer to test your own assumptions, you can build a custom Liberty Energy view in just a few minutes with Do it your way.
A great starting point for your Liberty Energy research is our analysis highlighting 1 key reward and 4 important warning signs that could impact your investment decision.
Looking for more investment ideas?
If Liberty has sharpened your thinking, do not stop there. Broaden your watchlist now with focused stock ideas that could suit very different portfolio goals.
This article by Simply Wall St is general in nature. We provide commentary based on historical data
and analyst forecasts only using an unbiased methodology and our articles are not intended to be financial advice. It does not constitute a recommendation to buy or sell any stock, and does not take account of your objectives, or your
financial situation. We aim to bring you long-term focused analysis driven by fundamental data.
Note that our analysis may not factor in the latest price-sensitive company announcements or qualitative material.
Simply Wall St has no position in any stocks mentioned.
Our new AI Stock Screener scans the market every day to uncover opportunities.
• Dividend Powerhouses (3%+ Yield)
• Undervalued Small Caps with Insider Buying
• High growth Tech and AI Companies
Or build your own from over 50 metrics.
Have feedback on this article? Concerned about the content? Get in touch with us directly. Alternatively, email editorial-team@simplywallst.com