**Tools:** Python (GeoPandas, Matplotlib)
**Data Source:** US Department of Labor H-1B Labor Condition Application (LCA) Disclosure Data
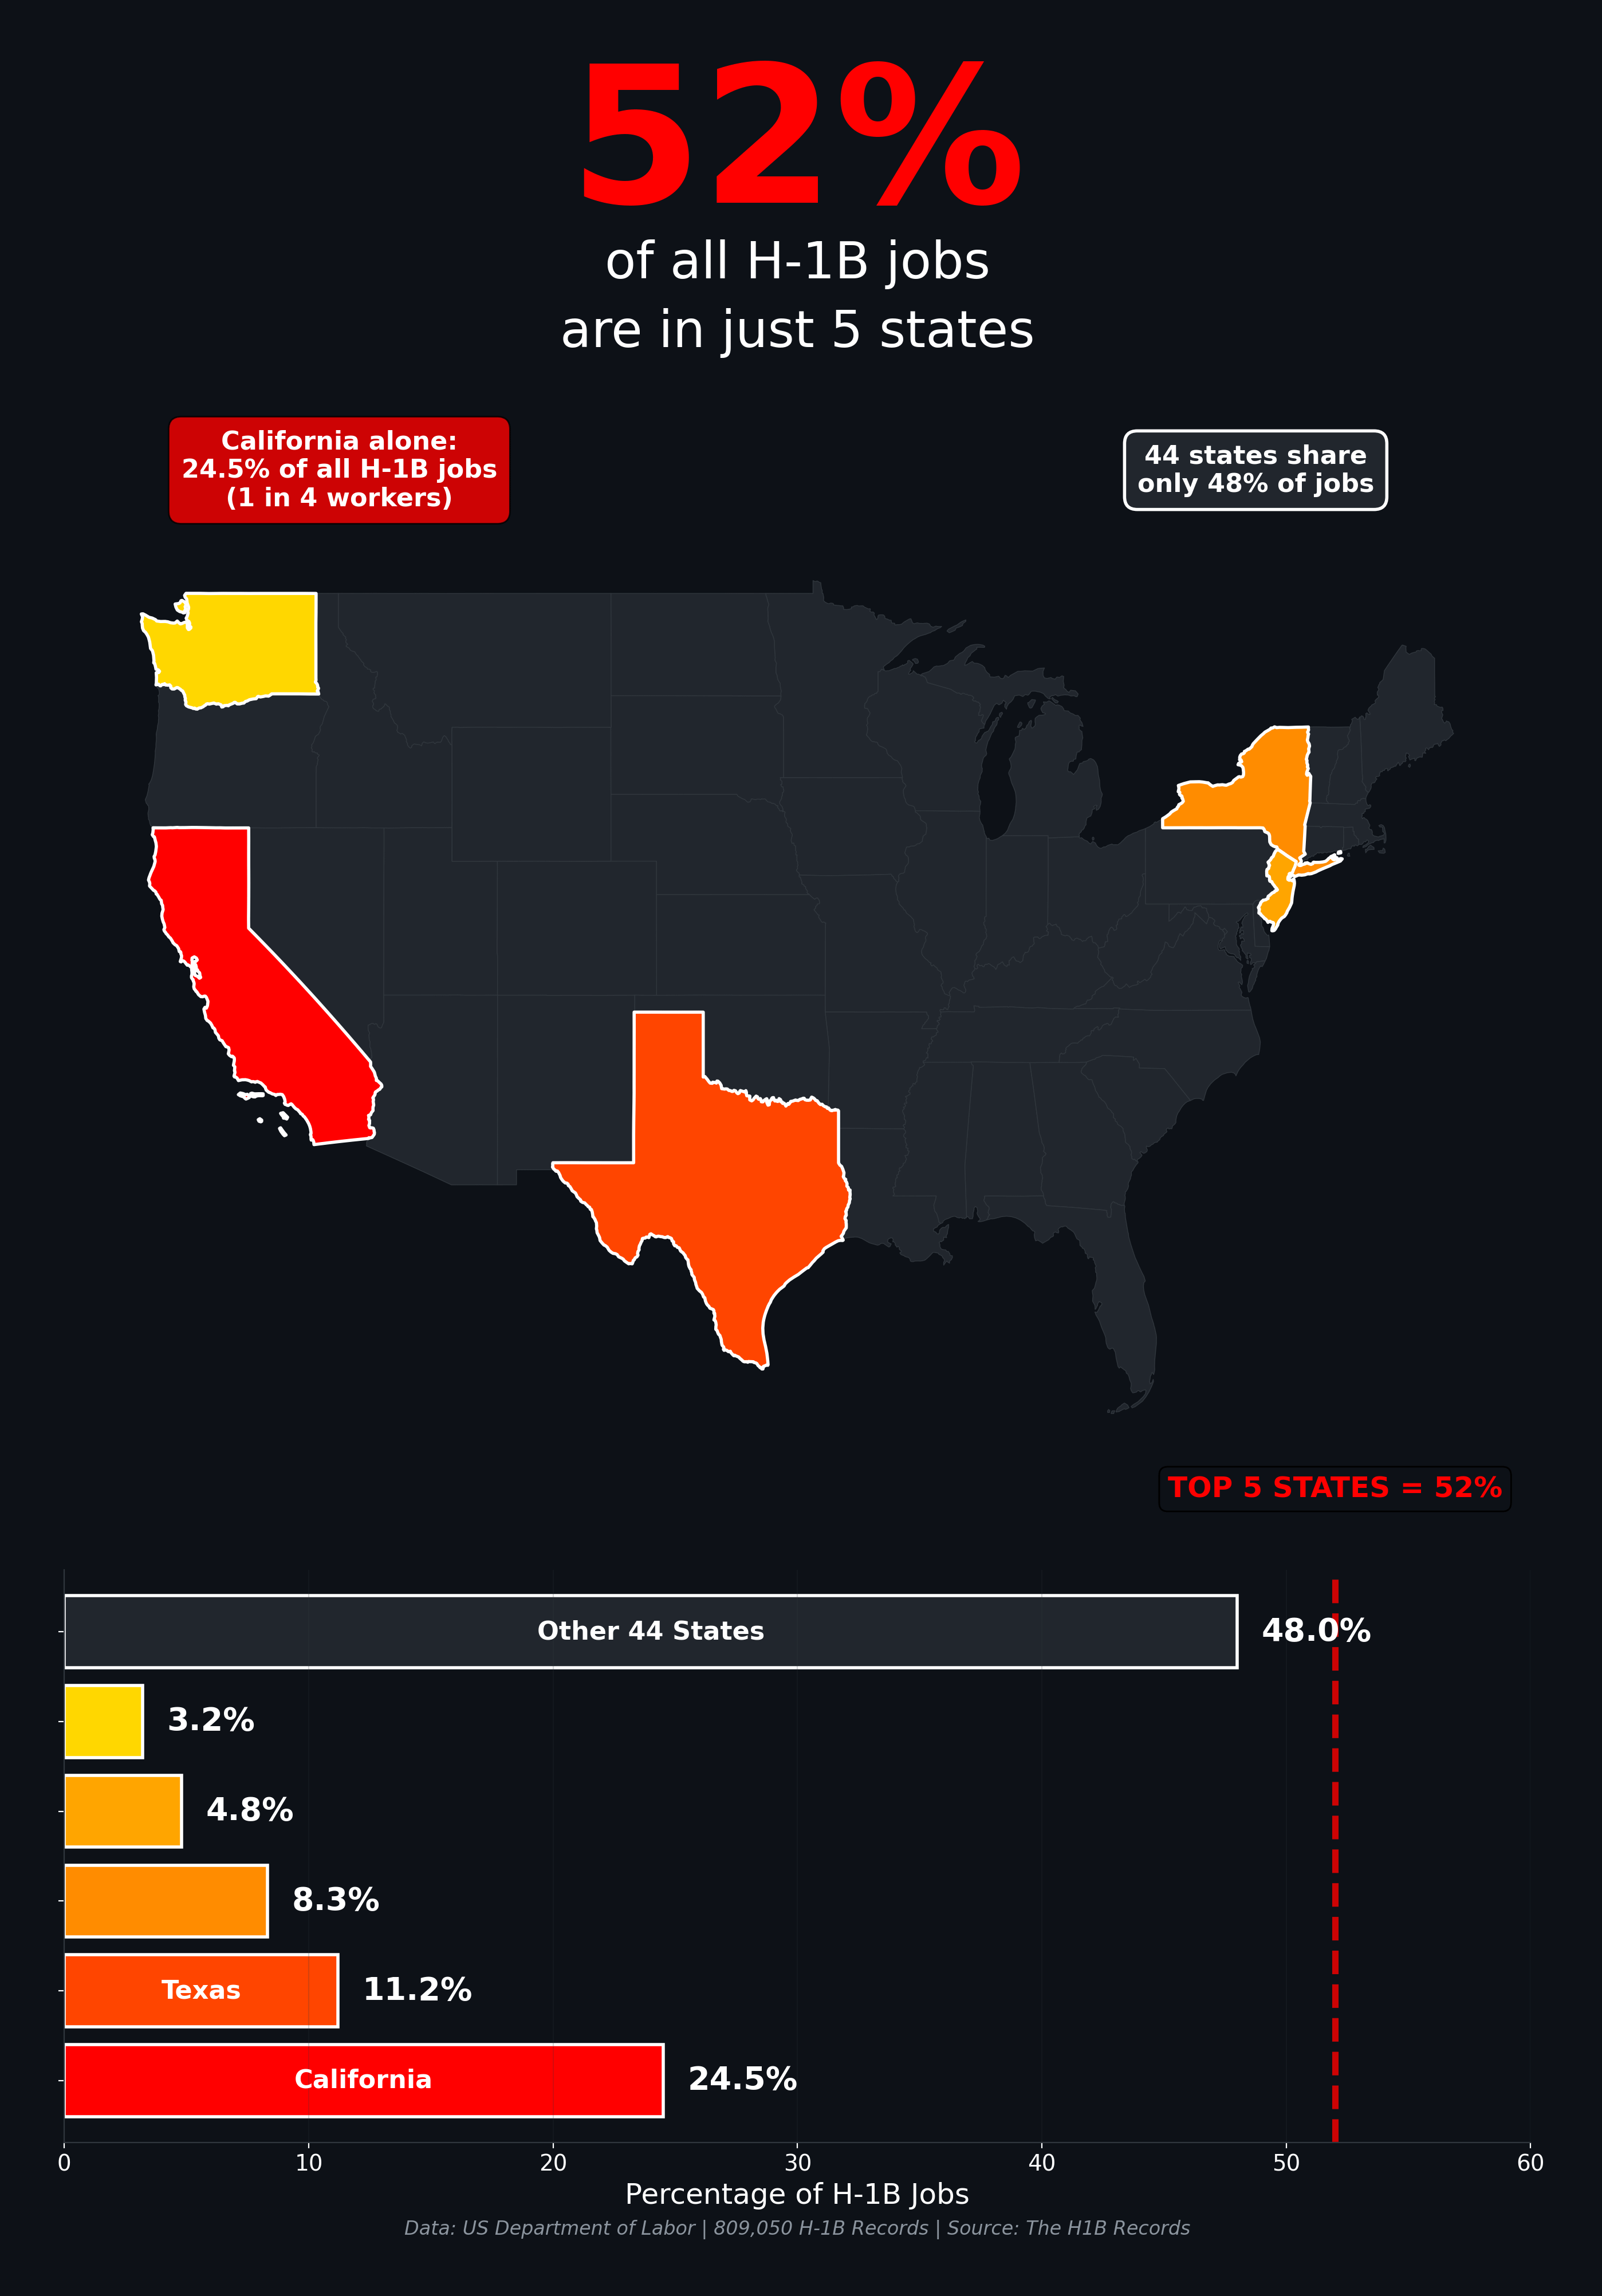
**Sample Size:** 809,050 H-1B visa records
—
**Key Findings:**
**Top 5 States (52.0% of all H-1B jobs):**
– 🔴 **California: 24.5%** — Nearly 1 in 4 H-1B workers
– 🟠 **Texas: 11.2%**
– 🟡 **New York: 8.3%**
– 🟢 **New Jersey: 4.8%**
– 🔵 **Washington: 3.2%**
**The Other 44 States: 48.0%** — That’s right, 44 states combined have LESS than California alone.
—
**Mind-blowing stats:**
– California has more H-1B workers than the bottom ~40 states combined
– If you’re an H-1B holder, there’s a 1 in 4 chance you’re in California
– The geographic concentration is primarily driven by Big Tech hubs (Silicon Valley, Seattle) and major metros (NYC, Houston, Austin)
**Why this matters:**
This extreme concentration creates unique policy challenges around housing costs, immigration processing centers, and regional economic dependency on H-1B labor.
—
**Methodology:** Analyzed public LCA disclosure data. Each H-1B petition requires employers to file an LCA specifying the job location. Percentages represent the distribution of approved LCA applications by state.
**Data notes:**
– This represents LCA filings, which can include renewals and transfers
– Continental US only (excludes AK, HI)
Happy to answer questions about the data or methodology!
sarhoshamiral on
Or the map of where head quarters and large campuses are for sectors that use H1B because talent doesnt exist in US despite what many claim it does.
Exact-Challenge9213 on
Well in fairness those states have about a third of the U.S. population
AoeDreaMEr on
Now do total number of jobs of same companies in each state. You will have your answer.
drsupermrcool on
It is lopsided, but also worth noting these states have ~32% of the population (a more accurate metric on the 32% would be to get the civilian participation rate from each state multiplied by the pop of the state, compared to the country total civ part of 62% – 210m).
TooSmalley on
I’m pretty sure those five states make up like 70% of the United States GDP
madlabdog on
I think it goes hand in hand with distribution of tech jobs in US.
zoqfotpik on
Half of all America’s jobs are in the same 5 states.
Kumquat_of_Pain on
Total population of those 5 states is 105 million. Is population is 342 million.
So per capita these are about 30% of the total population of the US.
CoogleEnPassant on
We need per capita. Right now all we see is a the 5 states with the most jobs
no_sight on
Obviously?
California, Texas, New York are the 3 most populous states. New Jersey has an oversized share from people living in New Jersey and working in NYC.
Washington is here because of an oversized tech presence in the city with Amazon, Microsoft, Boeing.
luxtabula on
In NY/NJ that percentage is concentrated in a thin belt going from NYC to Philadelphia, spread through both tech and bio tech/pharmaceutical jobs.
AEW_SuperFan on
It’s where Fortune 500 companies are located. H1-B aren’t used by smaller companies. Only large companies have lawyer teams to get these done.
Bearchiwuawa on
people live in populated areas. wow.
mannisbaratheon97 on
No way that’s where all my relatives live
ratpH1nk on
Would love to see it based on tech. Because I bet (at least) Texas, Cali and Washington as 90% tech. 100% short cut for cheap labor that is 100% being exploited.
Imkindaalrightiguess on
Oh wow you found all the tech companies
People live in cities posting
Connathon on
I think is should be mandatory in this group to use per capita if dealing with people counts
iKidA on
Wow what a genius graph – they should’ve hired you instead of the h1b
HardTacoKit on
Well, yeah, they are the biggest population states. Shocking.
timelessblur on
not surprised as a lot of tech jobs. One kicker about tech jobs is it is one of the fields that slaries on the job is high enough to not have to prove they tried to fine someone who does not require a visa first. It was funny as they always paid them just over that cap….. BTW I make more than they do so they were not even paying competitive wages.
Moneyshot_ITF on
60-80% of Americans lettuce comes from central California
mixony on
This graph seems to be from between jan 3 1959 and aug 21 1959 when US had 49 states
Cobbdouglas55 on
Where’s the guy with the people live in cities link?
Unique_Carpet1901 on
This stats is not as exciting.
SarahAlicia on
How to stop h1-b1 abuse:
Not allowed to be used by contractors
Not allowed to be used by amazon.
That’s it. That will solve all the issues.
Juls7243 on
About 100 M people live in those states. Its not that abnormal as not all industries are located equally across a country. This is not surprising at all.
jrex035 on
Surprised VA didnt make the list of top states
Priddee on
This isn’t very revolutionary or meaningful. H-B1 visas are mostly for Tech, Finance, Pharma/biotech and large multinational corps.
Those 5 states are the hubs for those things.
compoundblock666 on
Can we ban all visa programs
Legit all it does is underpay Americans and uncut small businesses trying to compete in any market.
The company I work for aphix is using Visa workers and cut our hours during the buyout
Half of all the workers left
AFF123456 on
Isn’t this a little r/PeopleLiveInCities?
Kimuraflow on
Is this just where the registered office is located? Mine will show up as Texas even though I live and work in another state
dbcwb on
I feel like a more interesting graph would be something like H-1B jobs per capital.
Brown_Star on
These are also some of the biggest tech job hubs in america. Nobody is hiring programmers for corn fields.
Now, if america shifted focus back to science, math, and reading instead of faith based education, we might not need H-1b workers.
fr0z3nf1r3 on
Of those states, only Texas seems to want to get rid of their H-1B people.
So maybe just make it a state issue
peternormal on
Every map is a population map.
SalsaForte on
For non-US redittors.
H-1B jobs are U.S.-based positions for foreign professionals in “specialty occupations” requiring highly specialized knowledge and at least a bachelor’s degree.
Mehim222 on
All volume maps are just population maps. This data could be shown in a % of total workforce which would make it easier to compare state to state who is relying more on H1B1

![[OC] Half of America's H-1B Jobs Are in Just 5 States](https://www.byteseu.com/wp-content/uploads/2026/02/u6lmfv2ukhig1-1072x1536.png "[OC] Half of America’s H-1B Jobs Are in Just 5 States")
38 Comments
**[OC]**
**Tools:** Python (GeoPandas, Matplotlib)
**Data Source:** US Department of Labor H-1B Labor Condition Application (LCA) Disclosure Data
**Sample Size:** 809,050 H-1B visa records
—
**Key Findings:**
**Top 5 States (52.0% of all H-1B jobs):**
– 🔴 **California: 24.5%** — Nearly 1 in 4 H-1B workers
– 🟠 **Texas: 11.2%**
– 🟡 **New York: 8.3%**
– 🟢 **New Jersey: 4.8%**
– 🔵 **Washington: 3.2%**
**The Other 44 States: 48.0%** — That’s right, 44 states combined have LESS than California alone.
—
**Mind-blowing stats:**
– California has more H-1B workers than the bottom ~40 states combined
– If you’re an H-1B holder, there’s a 1 in 4 chance you’re in California
– The geographic concentration is primarily driven by Big Tech hubs (Silicon Valley, Seattle) and major metros (NYC, Houston, Austin)
**Why this matters:**
This extreme concentration creates unique policy challenges around housing costs, immigration processing centers, and regional economic dependency on H-1B labor.
—
**Methodology:** Analyzed public LCA disclosure data. Each H-1B petition requires employers to file an LCA specifying the job location. Percentages represent the distribution of approved LCA applications by state.
**Data notes:**
– This represents LCA filings, which can include renewals and transfers
– Continental US only (excludes AK, HI)
Happy to answer questions about the data or methodology!
Or the map of where head quarters and large campuses are for sectors that use H1B because talent doesnt exist in US despite what many claim it does.
Well in fairness those states have about a third of the U.S. population
Now do total number of jobs of same companies in each state. You will have your answer.
It is lopsided, but also worth noting these states have ~32% of the population (a more accurate metric on the 32% would be to get the civilian participation rate from each state multiplied by the pop of the state, compared to the country total civ part of 62% – 210m).
I’m pretty sure those five states make up like 70% of the United States GDP
I think it goes hand in hand with distribution of tech jobs in US.
Half of all America’s jobs are in the same 5 states.
Total population of those 5 states is 105 million. Is population is 342 million.
So per capita these are about 30% of the total population of the US.
We need per capita. Right now all we see is a the 5 states with the most jobs
Obviously?
California, Texas, New York are the 3 most populous states. New Jersey has an oversized share from people living in New Jersey and working in NYC.
Washington is here because of an oversized tech presence in the city with Amazon, Microsoft, Boeing.
In NY/NJ that percentage is concentrated in a thin belt going from NYC to Philadelphia, spread through both tech and bio tech/pharmaceutical jobs.
It’s where Fortune 500 companies are located. H1-B aren’t used by smaller companies. Only large companies have lawyer teams to get these done.
people live in populated areas. wow.
No way that’s where all my relatives live
Would love to see it based on tech. Because I bet (at least) Texas, Cali and Washington as 90% tech. 100% short cut for cheap labor that is 100% being exploited.
Oh wow you found all the tech companies
People live in cities posting
I think is should be mandatory in this group to use per capita if dealing with people counts
Wow what a genius graph – they should’ve hired you instead of the h1b
Well, yeah, they are the biggest population states. Shocking.
not surprised as a lot of tech jobs. One kicker about tech jobs is it is one of the fields that slaries on the job is high enough to not have to prove they tried to fine someone who does not require a visa first. It was funny as they always paid them just over that cap….. BTW I make more than they do so they were not even paying competitive wages.
60-80% of Americans lettuce comes from central California
This graph seems to be from between jan 3 1959 and aug 21 1959 when US had 49 states
Where’s the guy with the people live in cities link?
This stats is not as exciting.
How to stop h1-b1 abuse:
Not allowed to be used by contractors
Not allowed to be used by amazon.
That’s it. That will solve all the issues.
About 100 M people live in those states. Its not that abnormal as not all industries are located equally across a country. This is not surprising at all.
Surprised VA didnt make the list of top states
This isn’t very revolutionary or meaningful. H-B1 visas are mostly for Tech, Finance, Pharma/biotech and large multinational corps.
Those 5 states are the hubs for those things.
Can we ban all visa programs
Legit all it does is underpay Americans and uncut small businesses trying to compete in any market.
The company I work for aphix is using Visa workers and cut our hours during the buyout
Half of all the workers left
Isn’t this a little r/PeopleLiveInCities?
Is this just where the registered office is located? Mine will show up as Texas even though I live and work in another state
I feel like a more interesting graph would be something like H-1B jobs per capital.
These are also some of the biggest tech job hubs in america. Nobody is hiring programmers for corn fields.
Now, if america shifted focus back to science, math, and reading instead of faith based education, we might not need H-1b workers.
Of those states, only Texas seems to want to get rid of their H-1B people.
So maybe just make it a state issue
Every map is a population map.
For non-US redittors.
H-1B jobs are U.S.-based positions for foreign professionals in “specialty occupations” requiring highly specialized knowledge and at least a bachelor’s degree.
All volume maps are just population maps. This data could be shown in a % of total workforce which would make it easier to compare state to state who is relying more on H1B1