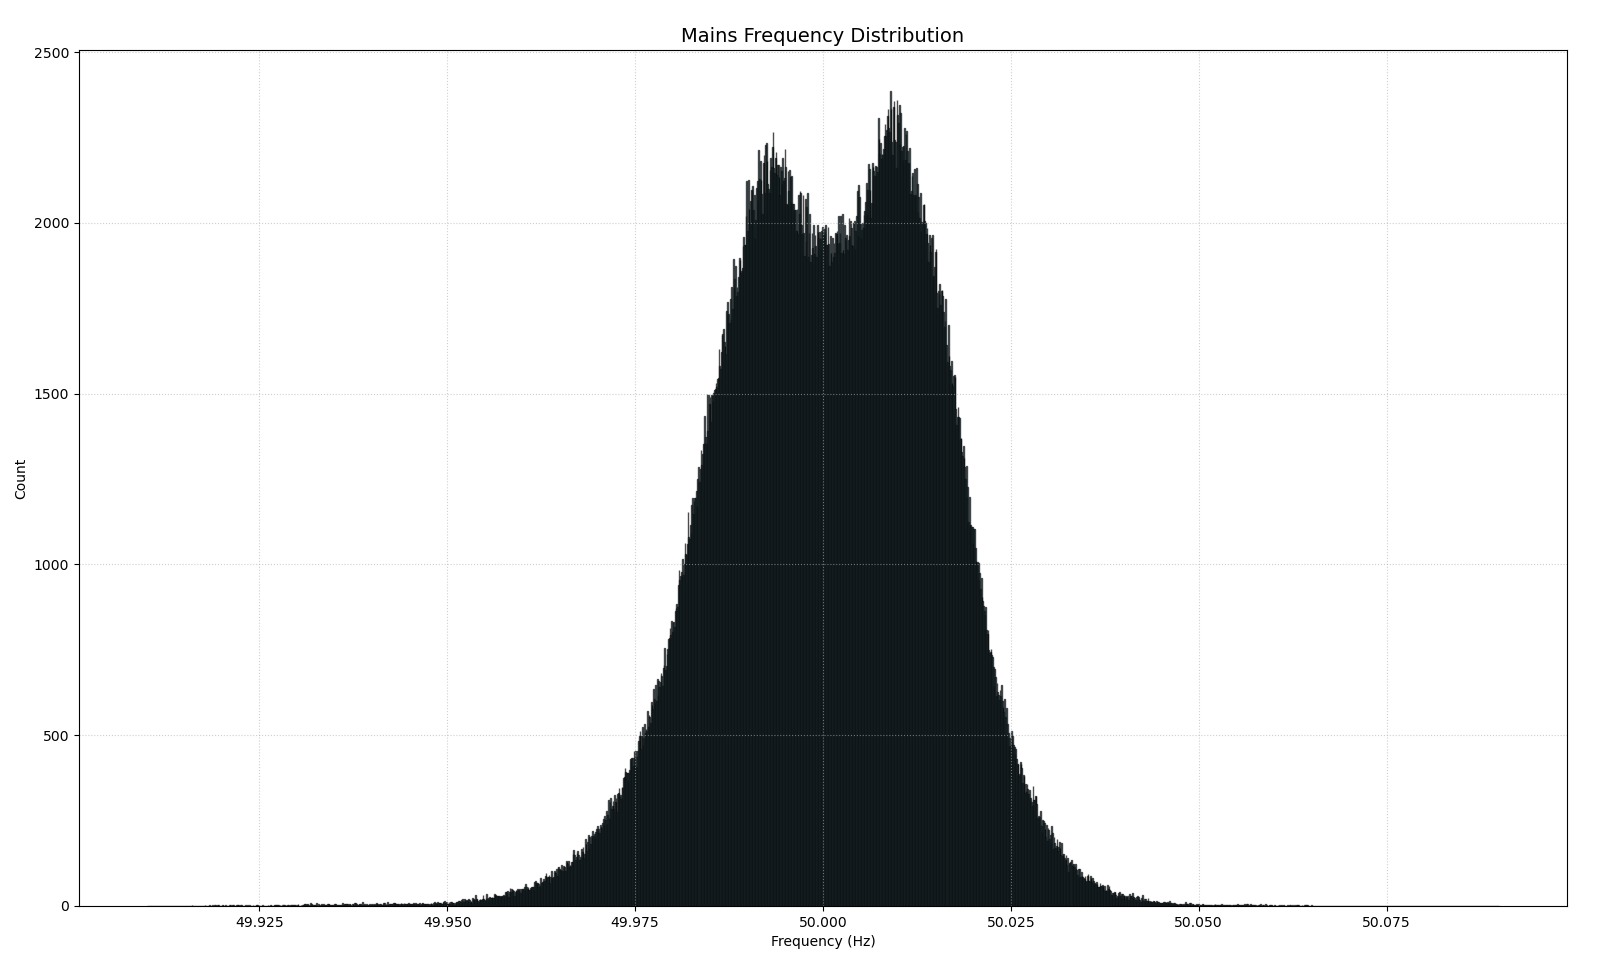
I was measuring the 50 Hz european electricity grid frequency every second for the past 10 days, and this is how often every frequency was counted (matplotlib) [OC]
I was measuring the 50 Hz european electricity grid frequency every second for the past 10 days, and this is how often every frequency was counted (matplotlib) [OC]
What did you use to measure with? Assume you measured zero crossing or so?
simonutd99 on
It’s a masterful feet to keep electric grids in balance and one hell of a disaster when it goes wrong
Sisyphuss5MinBreak on
Any guess why this is a bimodel distribution?
Xaephos on
I’m unfamiliar with electrical grids.
If the peaks were closer to the +/- 0.025 intervals would that be enough to be a considerable risk?
5wmotor on
So that’s why my microwave clock goes off over time.
sw1ss_dude on
The variations can be due to the accuracy of measurements, no?
das_Keks on
Since you have all the data, can you quickly calculate the average?
itsstillearly on
The frequency of frequencies
tomemyboard on
You should get a hold of Monarch. That looks like you might have a MUTO problem
kapege on
The grid tries to have 86400 x 50 = 4.320.000 current harmonics within 24 hours. With that harmonics a lot of electric clocks are driven and they does not need to be adjusted ever.
Kaka79 on
Now let’s see the average frequency over time (1 minute intervals)
TattiXD on
Did you calculate where average actually is? in diagram it seems to be bit above 50Hz
ddl_smurf on
If you still have the raw data, could you look at something like periods per day ? I’m curious on the longer term stability, there used to be clocks that relied on this
hackerbots on
If you happen to be in Berlin near the Hbf, you can actually go over to the 50Hertz building just north of Nordhafen where they have a live digital display of the grid frequency. I walk past it on my commute every day. Neat stuff.
enygma999 on
Have you got the frequency over time as well? I think that would be interesting to see beside this.

![I was measuring the 50 Hz european electricity grid frequency every second for the past 10 days, and this is how often every frequency was counted (matplotlib) [OC]](https://www.byteseu.com/wp-content/uploads/2026/02/uwoiet260uig1-1536x929.png "I was measuring the 50 Hz european electricity grid frequency every second for the past 10 days, and this is how often every frequency was counted (matplotlib) [OC]")
15 Comments
What did you use to measure with? Assume you measured zero crossing or so?
It’s a masterful feet to keep electric grids in balance and one hell of a disaster when it goes wrong
Any guess why this is a bimodel distribution?
I’m unfamiliar with electrical grids.
If the peaks were closer to the +/- 0.025 intervals would that be enough to be a considerable risk?
So that’s why my microwave clock goes off over time.
The variations can be due to the accuracy of measurements, no?
Since you have all the data, can you quickly calculate the average?
The frequency of frequencies
You should get a hold of Monarch. That looks like you might have a MUTO problem
The grid tries to have 86400 x 50 = 4.320.000 current harmonics within 24 hours. With that harmonics a lot of electric clocks are driven and they does not need to be adjusted ever.
Now let’s see the average frequency over time (1 minute intervals)
Did you calculate where average actually is? in diagram it seems to be bit above 50Hz
If you still have the raw data, could you look at something like periods per day ? I’m curious on the longer term stability, there used to be clocks that relied on this
If you happen to be in Berlin near the Hbf, you can actually go over to the 50Hertz building just north of Nordhafen where they have a live digital display of the grid frequency. I walk past it on my commute every day. Neat stuff.
Have you got the frequency over time as well? I think that would be interesting to see beside this.