
![Most common runway numbers by US state [OC]](https://www.byteseu.com/wp-content/uploads/2026/02/5qvydkvv9vig1-1024x576.png "Most common runway numbers by US state [OC]")
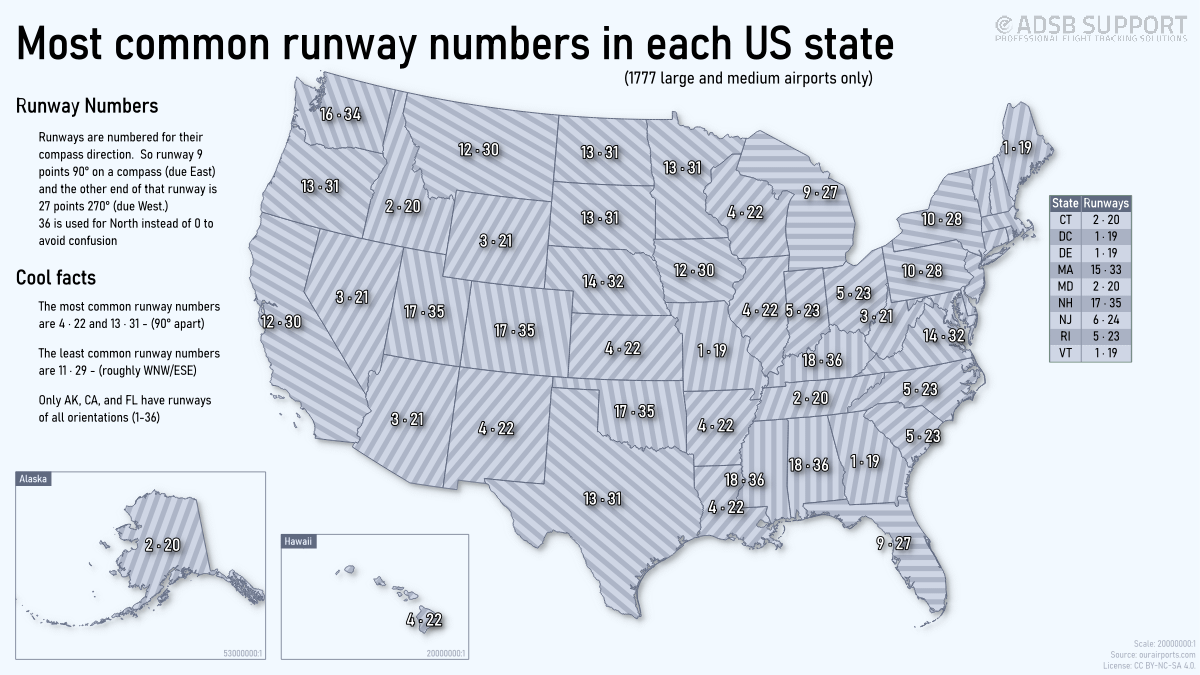
This is a visualization I did that looks at all the major airport runways in the United States, and shows the most common orientation in each state. This was a self-training improvement exercise for me, so I encourage you to give me any constructive criticism on how it could be improved.
I'm considering to do Europe, and other continents/countries as well if there is any interest.
I used runway data from ourairports.com, manipulated it in LibreOffice Calc, and mapped it in QGIS 3.44
Posted by ADSBSGM
19 Comments
Runway data is from ourairports.com, then manipulated it in LibreOffice Calc, and mapped in QGIS 3.44
Does this tell us something about prevailjng winds?
I see what you are going for here, but the numbers are unreadable with that background. Too many busy similarly gray elements. You might need to up the color contrast and enlarge/bold the labels so they can stand out from the background pattern.
CGP Grey has a nice Youtube video about this.
The lines you chose to fill in the states with makes this look like a failed optical illusion, not beautiful data representation
https://preview.redd.it/e9l28zp4evig1.jpeg?width=260&format=pjpg&auto=webp&s=490052a17f6f984949a0062931d0eb7e8c938eda
Is this showing the mode or some form of average? Do you compensate for airports with 4+ parallel runways? Maybe that doesn’t change results?
I think the lines are great — visually representing the orientation of the runway. Not sure if some of the other commentors got that?
Just the numbers need to be bolded.
Very interesting nonetheless!
Lmao I read this as runaway numbers, like people running away from home and in which direction they chose to go…
Very interesting and well done! Thank you!
While the lines on the states match the headings listed, they do not account for the magnetic declination. Take Washington state as an example. Yes, the runway headings at SeaTac, Paine Field and JBLM are 16-34, but the runways themselves are physically oriented true North-South. Take a look on google maps. This is b/c the magnetic declination of the area is approximately 15-16 degrees to the east. This will affect the lines you’ve drawn on your map.
What was the cutoff for ‘major’ airports?
Pretty fascinating map, should correlate nicely to prevailing wind directions. Important note that the further away from the equator, the greater deviance in geographic and magnetic direction, so a 9-27 runway won’t be exactly east west in the northern US
Michigan getting a lot of the lakes included into its borders. Big.
FL not getting the water and the keys like MI sucks for them
This is the most painful thing to look at I’ve seen here. I’d suggest making the numbers solid black with no outline or shading. And maybe lose some of the contrast in the angled lines filling in each state. Also, the only states featuring abbreviated names are not labeled. Not everyone knows which of those states are which. Plus the states that are large enough to fit the numbers don’t have their names abbreviated.
These are just some of my thoughts looking at this.
I’m not sure there are any airports in DC city limits. What does the data for DC represent? If it’s DCA, that’s in Virginia
Great idea. Love this as an aviation nerd.
I’m not an aviation nerd, but here is some non-expert context that many people here might be missing. The runway numbers indicate the compass direction divided by 10. For example, Florida the runways are most often east/west which are 90° and 270°. Therefore, the runway numbers are nine and 27. These are typically the same runway in opposite directions. Note that most of these numbers differ by 18 which indicates 180 degrees which is half of 360.
How did you make the striped fill for the states?
Love the map it displays:
The wind rose on adjacent states are usually similar = AL and MS, NC and SC, ND and SD
Being a pilot in Nevada, and having never (yet) landed on a 3-21 in the state, I would be interested in seeing data on traffic volume or number of airports along with this data.