

Feb 15, 2026
IndexBox has just published a new report: EU – Lifts, Elevators, Moving Stairways and Draglines – Market Analysis, Forecast, Size, Trends And Insights.
This article provides a comprehensive analysis of the European Union market for lifts, elevators, moving stairways, and draglines. It reports that in 2024, market consumption decreased to 614K units ($12.9B in value), following a peak in 2022. Production, however, grew to 728K units ($15.2B). The market is forecast to grow at a CAGR of +1.8% in volume and +3.3% in value through 2035, reaching 747K units and $18.5B. Denmark is the standout leader in both consumption and per capita consumption, while Italy, Spain, and Germany are the top exporters. The report details significant trade dynamics, including a sharp drop in imports in 2024 and varying import/export prices across member states.
Key Findings
- EU market forecast to reach 747K units ($18.5B) by 2035 following a recent consumption dip
- Denmark leads in per capita consumption (24 units per 1000 persons) and achieved the highest market value growth
- Production (728K units) exceeded consumption (614K units) in 2024, indicating a net export position
- Import volume fell sharply by 30% in 2024, while import prices surged by 34%
- Italy, Spain, and Germany are the top exporting countries by value, with the Netherlands commanding the highest export price
Market Forecast
Driven by increasing demand for lifts, elevators, moving stairways and draglines in the European Union, the market is expected to continue an upward consumption trend over the next decade. Market performance is forecast to decelerate, expanding with an anticipated CAGR of +1.8% for the period from 2024 to 2035, which is projected to bring the market volume to 747K units by the end of 2035.
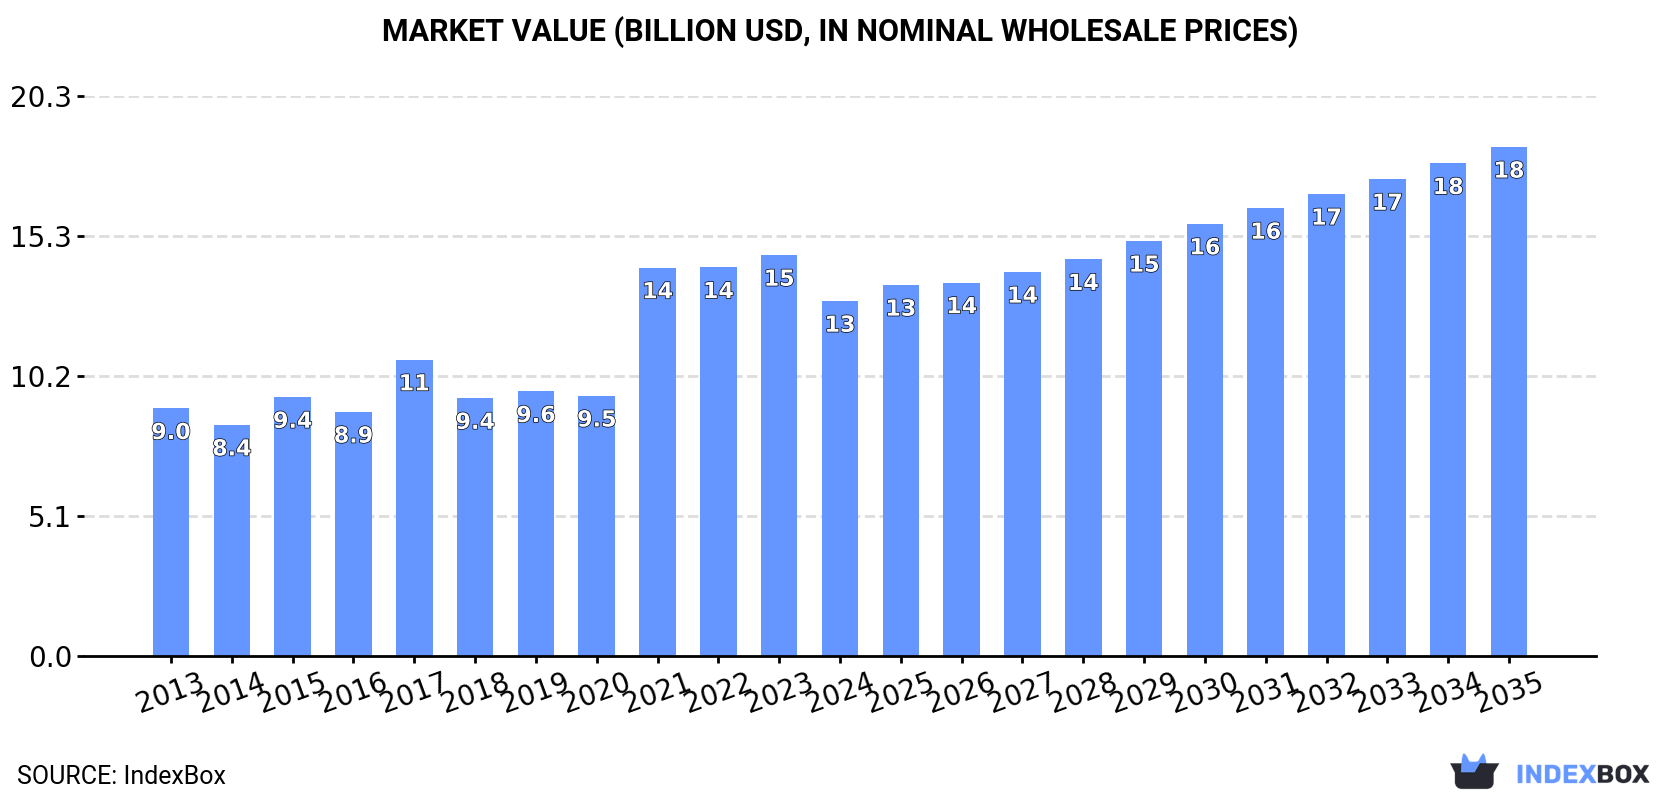
In value terms, the market is forecast to increase with an anticipated CAGR of +3.3% for the period from 2024 to 2035, which is projected to bring the market value to $18.5B (in nominal wholesale prices) by the end of 2035.
 ConsumptionEuropean Union’s Consumption of Lifts, Elevators, Moving Stairways and Draglines
In 2024, consumption of lifts, elevators, moving stairways and draglines decreased by -1.3% to 614K units, falling for the second year in a row after four years of growth. The total consumption indicated noticeable growth from 2013 to 2024: its volume increased at an average annual rate of +3.8% over the last eleven years. The trend pattern, however, indicated some noticeable fluctuations being recorded throughout the analyzed period. Based on 2024 figures, consumption decreased by -10.5% against 2022 indices. Over the period under review, consumption hit record highs at 686K units in 2022; however, from 2023 to 2024, consumption failed to regain momentum.
The value of the market for lifts, elevators, moving stairways and draglines in the European Union contracted to $12.9B in 2024, reducing by -11.5% against the previous year. This figure reflects the total revenues of producers and importers (excluding logistics costs, retail marketing costs, and retailers’ margins, which will be included in the final consumer price). The total consumption indicated a pronounced increase from 2013 to 2024: its value increased at an average annual rate of +3.3% over the last eleven years. The trend pattern, however, indicated some noticeable fluctuations being recorded throughout the analyzed period. The level of consumption peaked at $14.6B in 2023, and then fell in the following year.
Consumption By Country
The countries with the highest volumes of consumption in 2024 were Denmark (145K units), the Netherlands (99K units) and Spain (90K units), together accounting for 54% of total consumption.
From 2013 to 2024, the most notable rate of growth in terms of consumption, amongst the leading consuming countries, was attained by Denmark (with a CAGR of +21.3%), while consumption for the other leaders experienced more modest paces of growth.
In value terms, the largest lift, elevator, stairway and dragline markets in the European Union were Denmark ($3B), the Netherlands ($2.4B) and Germany ($2.1B), together accounting for 58% of the total market.
In terms of the main consuming countries, Denmark, with a CAGR of +23.0%, saw the highest growth rate of market size over the period under review, while market for the other leaders experienced more modest paces of growth.
In 2024, the highest levels of lift, elevator, stairway and dragline per capita consumption was registered in Denmark (24 units per 1000 persons), followed by the Netherlands (5.6 units per 1000 persons), Spain (1.9 units per 1000 persons) and Belgium (1.3 units per 1000 persons), while the world average per capita consumption of lift, elevator, stairway and dragline was estimated at 1.4 units per 1000 persons.
In Denmark, lift, elevator, stairway and dragline per capita consumption increased at an average annual rate of +20.5% over the period from 2013-2024. In the other countries, the average annual rates were as follows: the Netherlands (+18.0% per year) and Spain (-5.7% per year).
ProductionEuropean Union’s Production of Lifts, Elevators, Moving Stairways and Draglines
In 2024, the amount of lifts, elevators, moving stairways and draglines produced in the European Union expanded markedly to 728K units, picking up by 13% compared with the year before. The total output volume increased at an average annual rate of +1.8% from 2013 to 2024; however, the trend pattern indicated some noticeable fluctuations being recorded in certain years. The pace of growth appeared the most rapid in 2021 with an increase of 31% against the previous year. Over the period under review, production hit record highs at 804K units in 2022; however, from 2023 to 2024, production failed to regain momentum.
In value terms, lift, elevator, stairway and dragline production reached $15.2B in 2024 estimated in export price. The total output value increased at an average annual rate of +2.6% from 2013 to 2024; however, the trend pattern indicated some noticeable fluctuations being recorded in certain years. The pace of growth appeared the most rapid in 2021 when the production volume increased by 37%. The level of production peaked at $16.4B in 2022; however, from 2023 to 2024, production remained at a lower figure.
Production By Country
The countries with the highest volumes of production in 2024 were Denmark (158K units), Spain (118K units) and the Netherlands (103K units), together comprising 52% of total production.
From 2013 to 2024, the most notable rate of growth in terms of production, amongst the leading producing countries, was attained by Denmark (with a CAGR of +21.4%), while production for the other leaders experienced more modest paces of growth.
ImportsEuropean Union’s Imports of Lifts, Elevators, Moving Stairways and Draglines
After five years of growth, supplies from abroad of lifts, elevators, moving stairways and draglines decreased by -30.3% to 158K units in 2024. Overall, imports, however, enjoyed prominent growth. The pace of growth was the most pronounced in 2017 when imports increased by 94%. The volume of import peaked at 227K units in 2023, and then declined remarkably in the following year.
In value terms, lift, elevator, stairway and dragline imports contracted to $2.6B in 2024. Total imports indicated a perceptible increase from 2013 to 2024: its value increased at an average annual rate of +4.5% over the last eleven-year period. The trend pattern, however, indicated some noticeable fluctuations being recorded throughout the analyzed period. Based on 2024 figures, imports increased by +37.0% against 2020 indices. The most prominent rate of growth was recorded in 2023 with an increase of 16%. As a result, imports reached the peak of $2.8B, and then dropped in the following year.
Imports By Country
The purchases of the nine major importers of lifts, elevators, moving stairways and draglines, namely Spain, Belgium, the Netherlands, France, Germany, Poland, Italy, Portugal and Austria, represented more than two-thirds of total import. Romania (5.3K units) held a little share of total imports.
From 2013 to 2024, the most notable rate of growth in terms of purchases, amongst the main importing countries, was attained by Romania (with a CAGR of +17.5%), while imports for the other leaders experienced more modest paces of growth.
In value terms, France ($381M), Germany ($341M) and the Netherlands ($335M) appeared to be the countries with the highest levels of imports in 2024, with a combined 41% share of total imports. Spain, Poland, Italy, Portugal, Austria, Belgium and Romania lagged somewhat behind, together comprising a further 34%.
Among the main importing countries, Portugal, with a CAGR of +9.3%, recorded the highest growth rate of the value of imports, over the period under review, while purchases for the other leaders experienced more modest paces of growth.
Import Prices By Country
In 2024, the import price in the European Union amounted to $16 thousand per unit, with an increase of 34% against the previous year. In general, the import price, however, saw a abrupt curtailment. The most prominent rate of growth was recorded in 2018 when the import price increased by 64%. The level of import peaked at $29 thousand per unit in 2013; however, from 2014 to 2024, import prices stood at a somewhat lower figure.
Prices varied noticeably by country of destination: amid the top importers, the country with the highest price was Germany ($25 thousand per unit), while Belgium ($4.4 thousand per unit) was amongst the lowest.
From 2013 to 2024, the most notable rate of growth in terms of prices was attained by Austria (-1.7%), while the other leaders experienced a decline in the import price figures.
ExportsEuropean Union’s Exports of Lifts, Elevators, Moving Stairways and Draglines
In 2024, shipments abroad of lifts, elevators, moving stairways and draglines increased by 8.2% to 272K units, rising for the third year in a row after two years of decline. Overall, exports continue to indicate a relatively flat trend pattern. The pace of growth appeared the most rapid in 2017 when exports increased by 57% against the previous year. The volume of export peaked at 312K units in 2019; however, from 2020 to 2024, the exports failed to regain momentum.
In value terms, lift, elevator, stairway and dragline exports shrank to $5.1B in 2024. The total export value increased at an average annual rate of +1.4% over the period from 2013 to 2024; however, the trend pattern remained consistent, with only minor fluctuations being observed throughout the analyzed period. The growth pace was the most rapid in 2023 with an increase of 16%. As a result, the exports attained the peak of $5.6B, and then reduced in the following year.
Exports By Country
Italy (50K units) and Spain (49K units) represented roughly 36% of total exports in 2024. It was distantly followed by Austria (25K units), Germany (24K units), Slovakia (23K units), the Netherlands (22K units), France (19K units) and Denmark (15K units), together creating a 47% share of total exports.
From 2013 to 2024, the biggest increases were recorded for Austria (with a CAGR of +21.2%), while shipments for the other leaders experienced more modest paces of growth.
In value terms, Italy ($819M), Spain ($796M) and Germany ($731M) constituted the countries with the highest levels of exports in 2024, with a combined 46% share of total exports. The Netherlands, Slovakia, Austria, France and Denmark lagged somewhat behind, together comprising a further 36%.
The Netherlands, with a CAGR of +8.3%, recorded the highest growth rate of the value of exports, in terms of the main exporting countries over the period under review, while shipments for the other leaders experienced more modest paces of growth.
Export Prices By Country
The export price in the European Union stood at $19 thousand per unit in 2024, declining by -15% against the previous year. Overall, the export price, however, saw a relatively flat trend pattern. The growth pace was the most rapid in 2020 when the export price increased by 29% against the previous year. The level of export peaked at $22 thousand per unit in 2023, and then fell markedly in the following year.
There were significant differences in the average prices amongst the major exporting countries. In 2024, amid the top suppliers, the country with the highest price was the Netherlands ($34 thousand per unit), while Denmark ($3.5 thousand per unit) was amongst the lowest.
From 2013 to 2024, the most notable rate of growth in terms of prices was attained by the Netherlands (+16.6%), while the other leaders experienced mixed trends in the export price figures.
This report provides a comprehensive view of the lift, elevator, stairway and dragline industry in European Union, tracking demand, supply, and trade flows across the regional value chain. It explains how demand across key channels and end-use segments shapes consumption patterns, while also mapping the role of input availability, production efficiency, and regulatory standards on supply.
Beyond headline metrics, the study benchmarks prices, margins, and trade routes so you can see where value is created and how it moves between exporters and importers within European Union. The analysis is designed to support strategic planning, market entry, portfolio prioritization, and risk management in the lift, elevator, stairway and dragline landscape in European Union.
Quick navigation
Key findings
- Regional demand is shaped by both household and industrial usage, with trade flows linking supply hubs to import-reliant countries.
- Pricing dynamics reflect unit values, freight costs, exchange rates, and regulatory shifts that affect sourcing decisions.
- Supply depends on input availability and production efficiency, creating distinct cost curves across European Union.
- Market concentration varies by country, creating different competitive landscapes and entry barriers.
- The 2035 outlook highlights where capacity investment and demand growth are most aligned within the region.
Report scope
The report combines market sizing with trade intelligence and price analytics for European Union. It covers both historical performance and the forward outlook to 2035, allowing you to compare cycles, structural shifts, and policy impacts across countries and sub-regions.
- Market size and growth in value and volume terms
- Consumption structure by end-use segments and countries
- Production capacity, output, and cost dynamics
- Regional trade flows, exporters, importers, and balances
- Price benchmarks, unit values, and margin signals
- Competitive context and market entry conditions
Product coverage
- Prodcom 28221630 – Electrically operated lifts and skip hoists
- Prodcom 28221650 – Lifts and skip hoists (excluding electrically operated)
- Prodcom 28221670 – Escalators and moving walkways
- Prodcom 28221740 – Pneumatic elevators and conveyors
- Prodcom 28221820 – Teleferics, chair-lifts, ski-draglines and traction mechanisms for funiculars
Country coverageCountry profiles and benchmarks
For the regional report, country profiles provide a consistent view of market size, trade balance, prices, and per-capita indicators across European Union. The profiles highlight the largest consuming and producing markets and allow direct benchmarking across peers.
Methodology
The analysis is built on a multi-source framework that combines official statistics, trade records, company disclosures, and expert validation. Data are standardized, reconciled, and cross-checked to ensure consistency across time series.
- International trade data (exports, imports, and mirror statistics)
- National production and consumption statistics
- Company-level information from financial filings and public releases
- Price series and unit value benchmarks
- Analyst review, outlier checks, and time-series validation
All data are normalized to a common product definition and mapped to a consistent set of codes. This ensures that comparisons across time are aligned and actionable.
Forecasts to 2035
The forecast horizon extends to 2035 and is based on a structured model that links lift, elevator, stairway and dragline demand and supply to macroeconomic indicators, trade patterns, and sector-specific drivers. The model captures both cyclical and structural factors and reflects known policy and technology shifts within European Union.
- Historical baseline: 2012-2025
- Forecast horizon: 2026-2035
- Scenario-based sensitivity to income growth, substitution, and regulation
- Capacity and investment outlook for major producing countries
Each country projection is built from its own historical pattern and the regional context, allowing the report to show where growth is concentrated and where risks are elevated.
Price analysis and trade dynamics
Prices are analyzed in detail, including export and import unit values, regional spreads, and changes in trade costs. The report highlights how seasonality, freight rates, exchange rates, and supply disruptions influence pricing and margins.
- Price benchmarks by country and sub-region
- Export and import unit value trends
- Seasonality and calendar effects in trade flows
- Price outlook to 2035 under baseline assumptions
Profiles of market participants
Key producers, exporters, and distributors are profiled with a focus on their operational scale, geographic footprint, product mix, and market positioning. This helps identify competitive pressure points, partnership opportunities, and routes to differentiation.
- Business focus and production capabilities
- Geographic reach and distribution networks
- Cost structure and pricing strategy indicators
- Compliance, certification, and sustainability context
How to use this report
- Quantify regional demand and identify the most attractive country markets
- Evaluate export opportunities and prioritize target destinations
- Track price dynamics and protect margins
- Benchmark performance against regional competitors
- Build evidence-based forecasts for investment decisions
This report is designed for manufacturers, distributors, importers, wholesalers, investors, and advisors who need a clear, data-driven picture of lift, elevator, stairway and dragline dynamics in European Union.
FAQ
What is included in the lift, elevator, stairway and dragline market in European Union?
The market size aggregates consumption and trade data at country and sub-regional levels, presented in both value and volume terms.
How are the forecasts to 2035 built?
The projections combine historical trends with macroeconomic indicators, trade dynamics, and sector-specific drivers.
Does the report cover prices and margins?
Yes, it includes export and import unit values, regional spreads, and a pricing outlook to 2035.
Which countries are profiled in detail?
The report provides profiles for the largest consuming and producing countries in European Union.
Can this report support market entry decisions?
Yes, it highlights demand hotspots, trade routes, pricing trends, and competitive context.