
![[OC] XKCD 3207: When did the largest share of the population live within 5° of zero magnetic declination?](https://www.byteseu.com/wp-content/uploads/2026/02/kzj6ctha2jjg1-1536x875.png "[OC] XKCD 3207: When did the largest share of the population live within 5° of zero magnetic declination?")
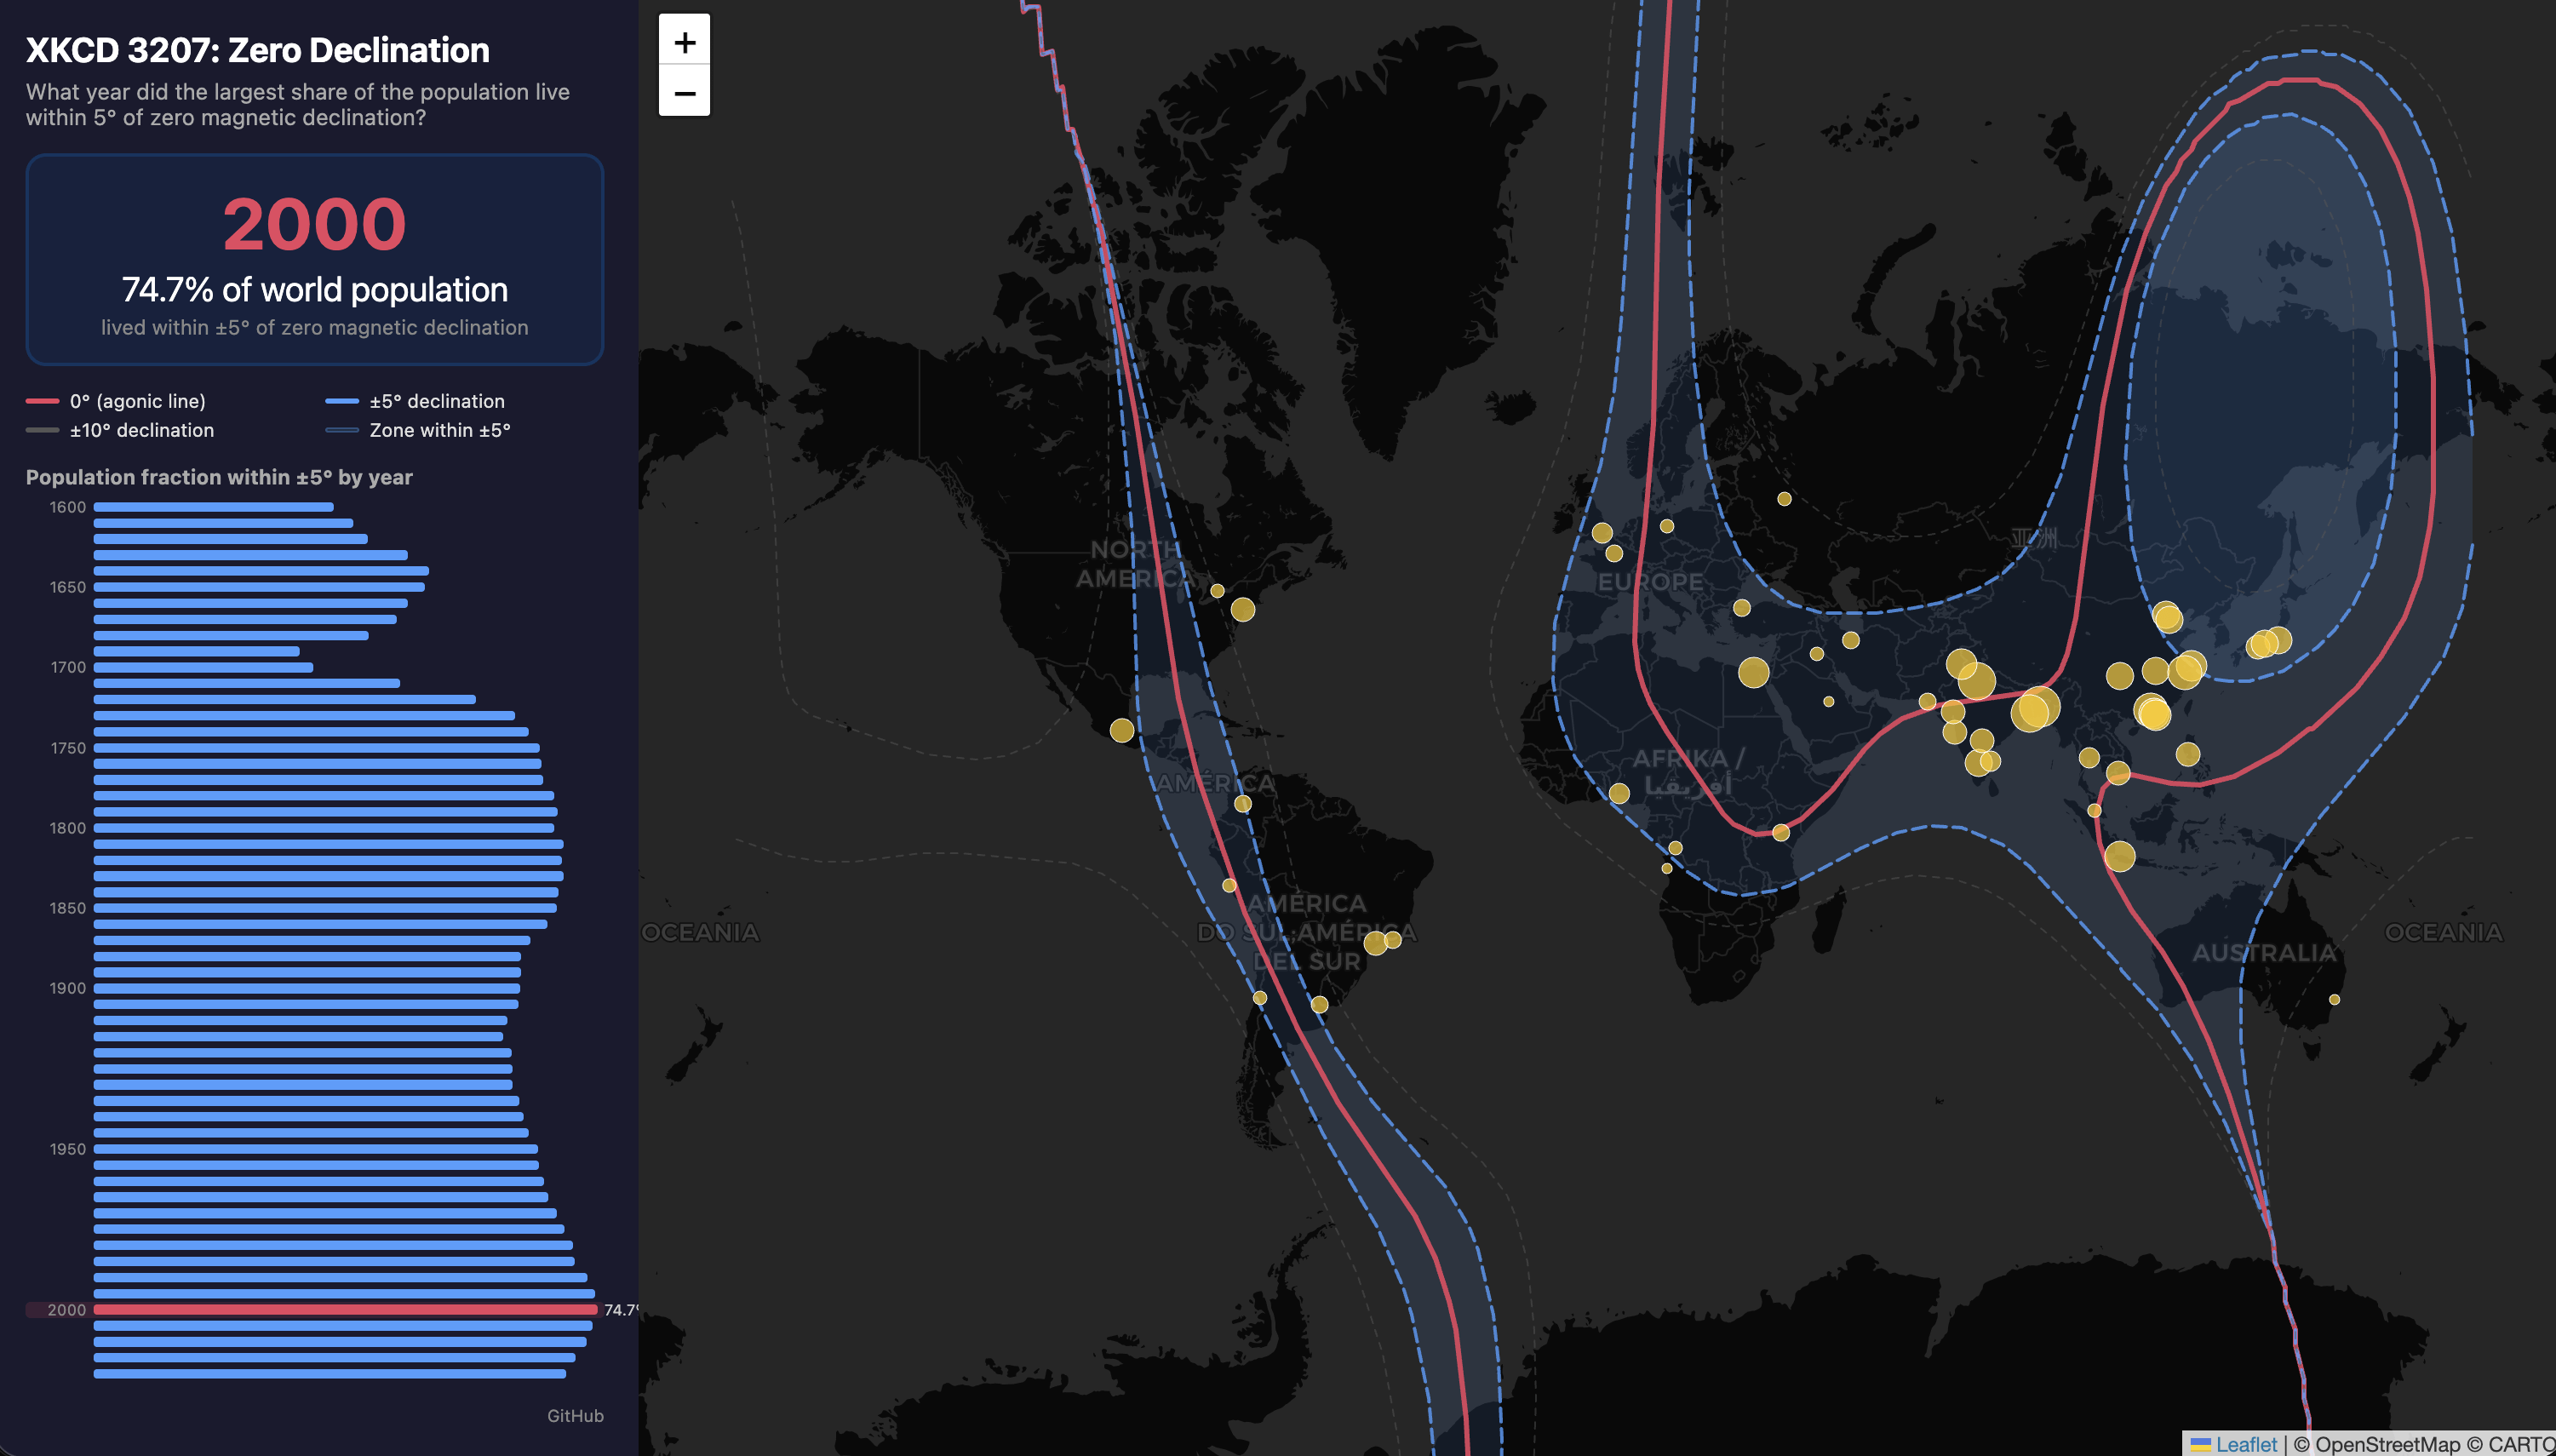
I got nerd sniped by the title text of XKCD 3207:
'The zero line in WMM2025 passes through a lot of population centers; I wonder what year the largest share of the population lived in a zone of less than 5° of declination,' he thought, derailing all other tasks for the rest of the day.
With some help from Claude Code, I built an interactive visualization to answer the question.
Posted by ahogue
6 Comments
Data sources:
[](https://github.com/awhogue/zero-declination#data-sources)
* **Magnetic declination (1590–1985):** [gufm1](https://royalsocietypublishing.org/doi/10.1098/rsta.2000.0569) model via `pymagglobal`
* **Magnetic declination (1990–2025):** [IGRF-14](https://www.ngdc.noaa.gov/IAGA/vmod/igrf.html) via `ppigrf`
* **Population (1600–2020):** [HYDE 3.3](https://public.yoda.uu.nl/geo/UU01/94FNH0.html) gridded historical population
Code: [https://github.com/awhogue/zero-declination](https://github.com/awhogue/zero-declination)
Tools: Claude Code (Opus 4.6 medium effort)
Thank you for your service
Instead of an xkcd being for something, there’s now something for an xkcd
Writing “Asia” in Chinese is very stupid.
Zero magnetic declination means there is no angle difference between True North and Magnetic North at a specific location.
This has to be purely coincidental
I would like to see it on a globe, or another set of projections that better visualizes the areas near the poles