
![[OC] I’ve been tracking my daily sneezes for 10+ years. Here the main results](https://www.byteseu.com/wp-content/uploads/2026/02/frr0zagb4ujg1-1024x631.png "[OC] I’ve been tracking my daily sneezes for 10+ years. Here the main results")
Source: Me. Since 2016, I’ve been logging my individual sneezes daily. Tools: Microsoft Excel
Here are the key findings:
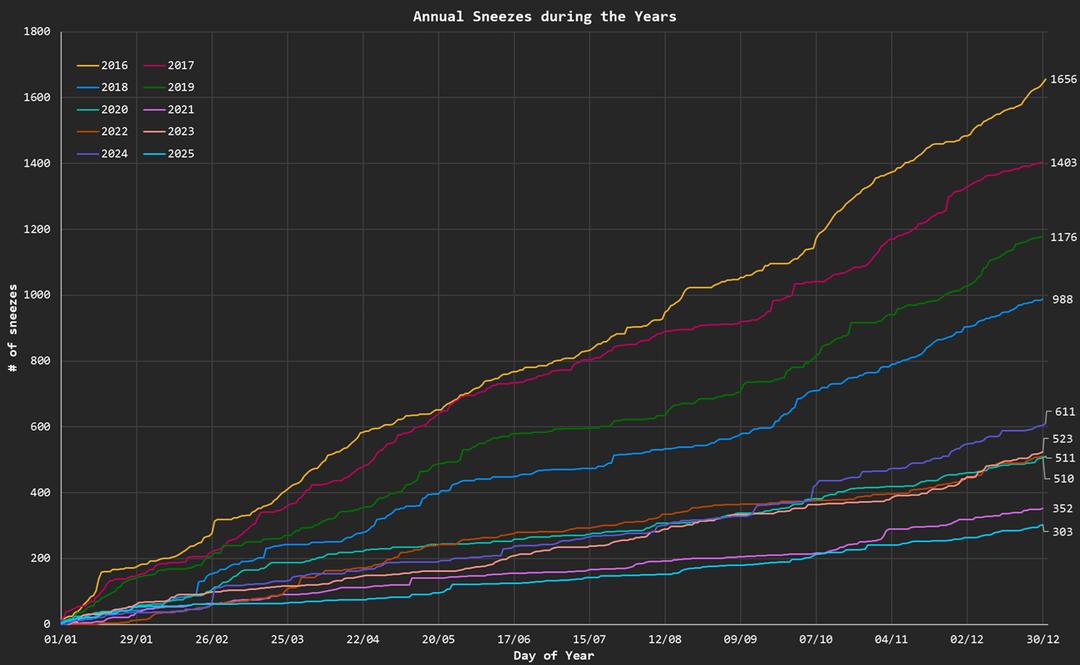
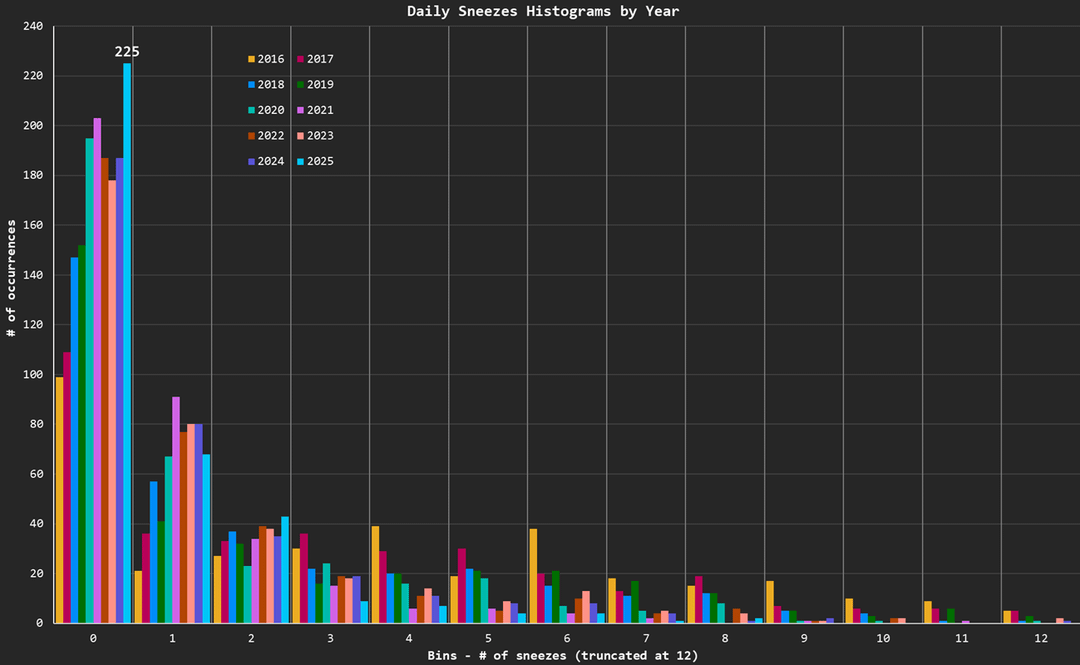
- Total yearly sneezes dropped from 1000-1500 to around 300-500 after 2019
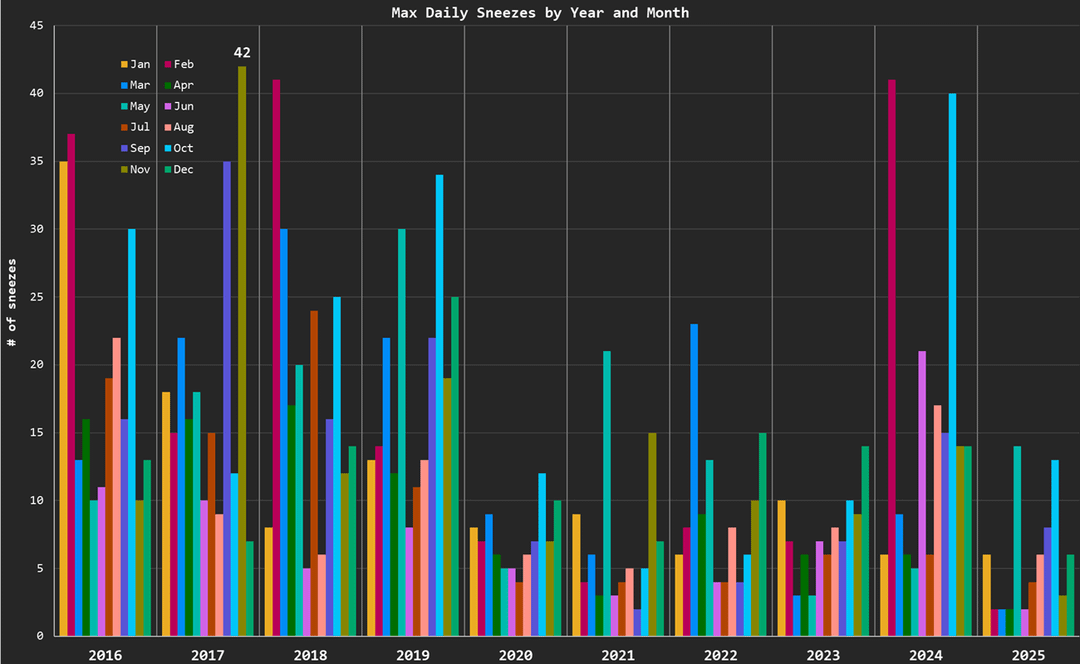
- Despite the overall decline, occasional “spike days” still occur, typically when I have a cold
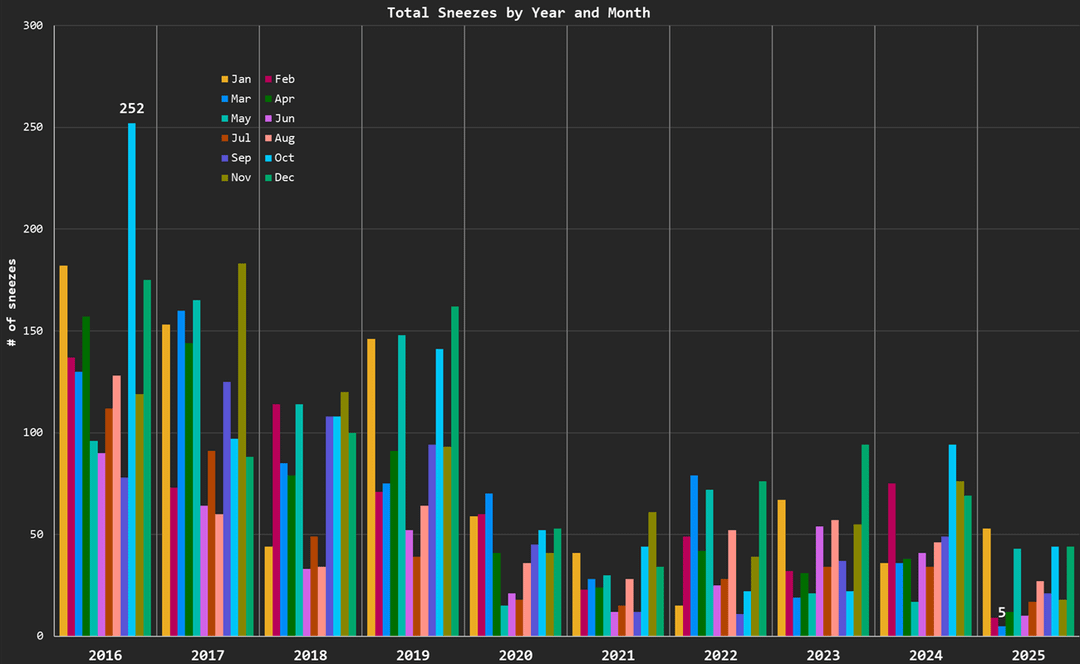
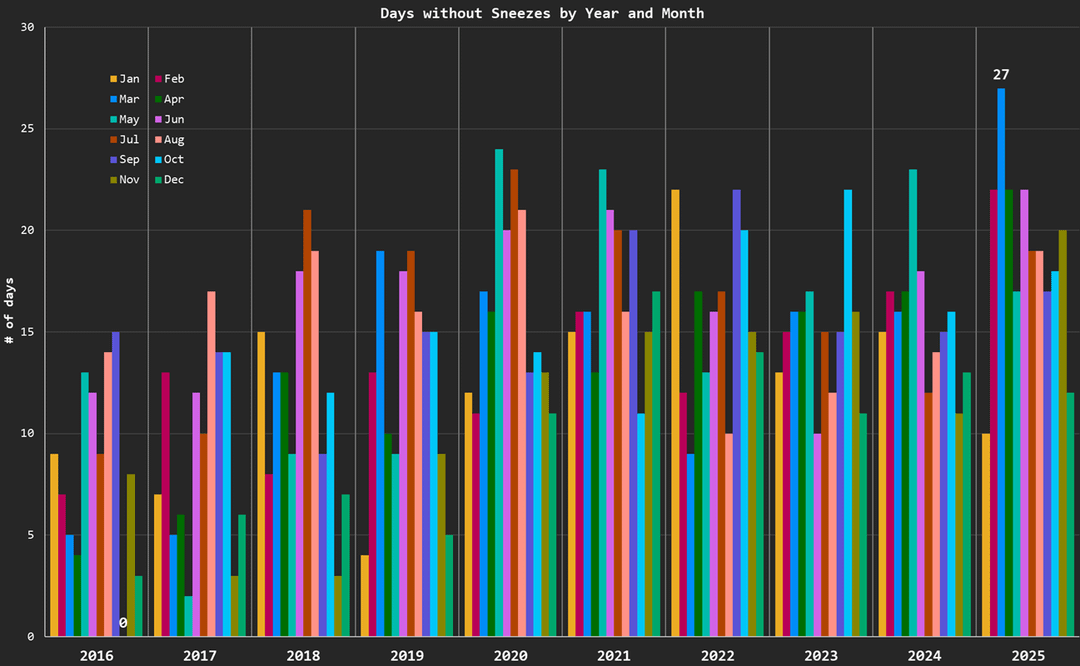
- The number of sneezes generally drops during summer
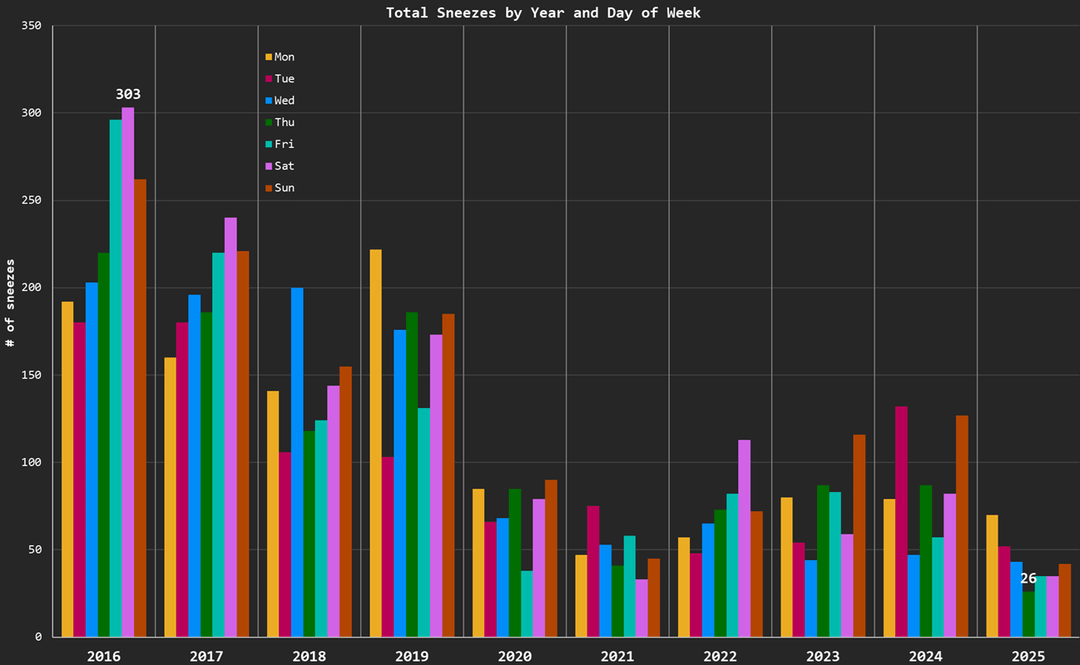
- Overall, weekends have been slightly more sneezy
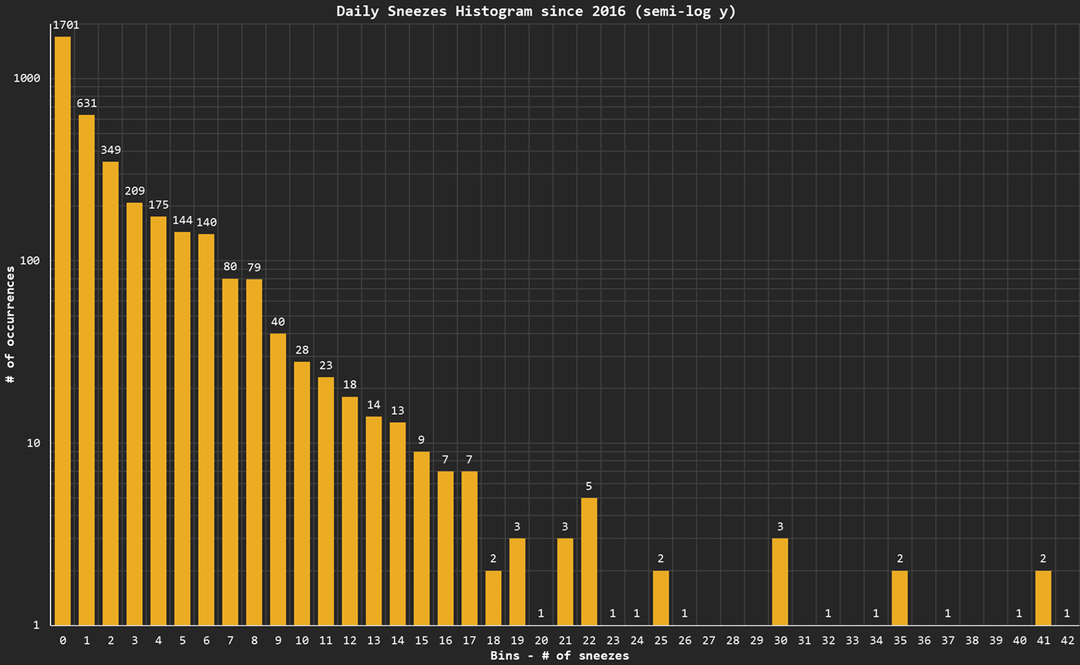
- The distribution of daily sneezes resembles a power law: most days have 0, few days have many
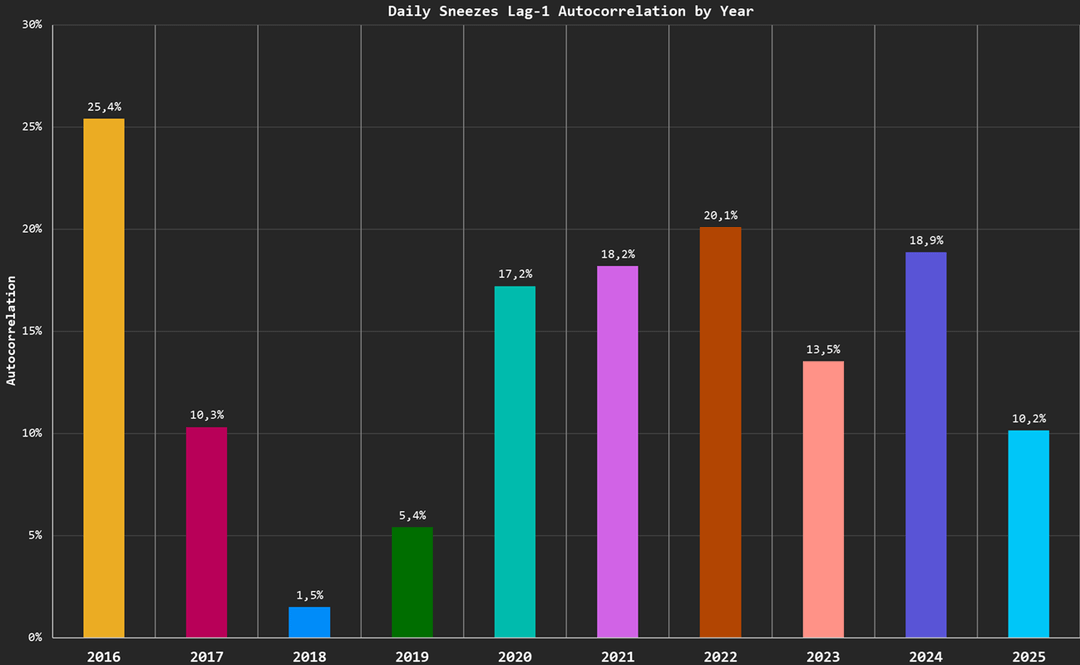
- The daily lag-1 autocorrelation during the years is slightly positive, meaning that a sneezy day is more likely followed by another, and the same is true for a day without sneezes
Records:
- The daily max is 42, recorded during 2017
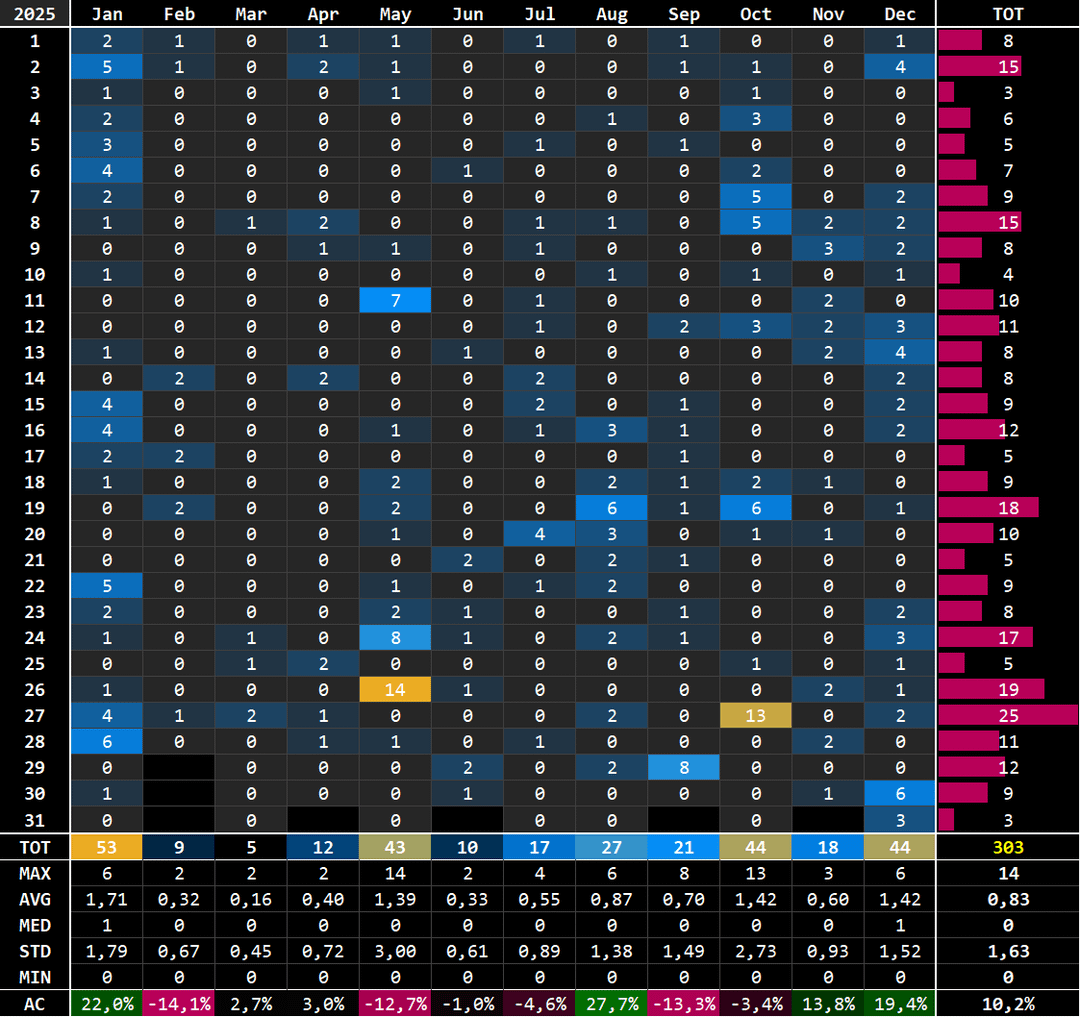
- The record month is October 2016 with 252 total sneezes, while the record low is March 2025 with only 5
- The yearly max is 1656 in 2016, while the record low is 303 in 2025
- The running total since 2016 is 8083 (including 2026)
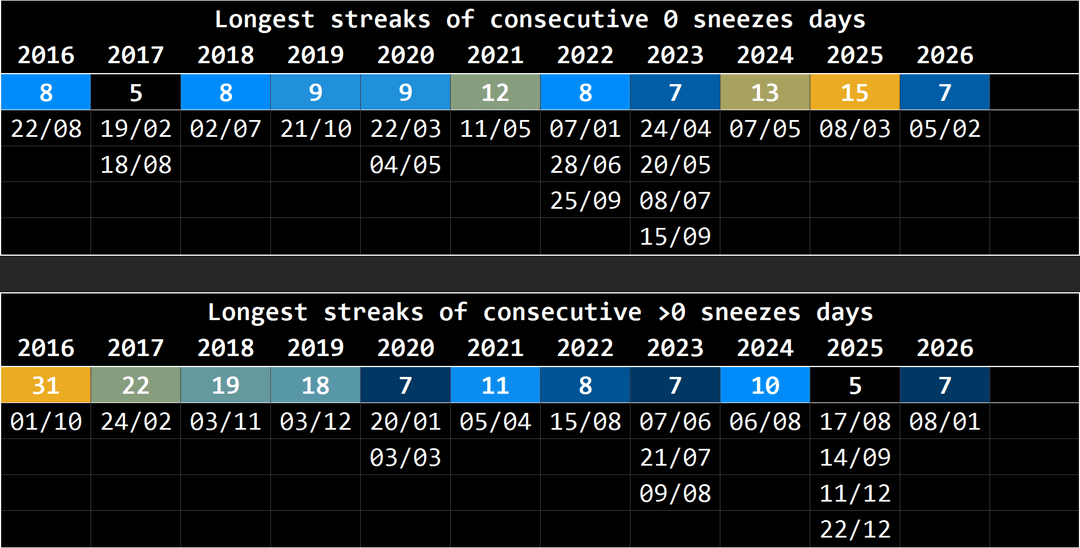
- Longest streak without sneezes: 15 days in March 2025
- Longest streak with sneezes: 31 days in October 2016, only recorded month with at least 1 sneeze per day
Some notes:
- The last table shows how I log raw data daily (2025 presented here), along with the related statistics
- I actually started in 2015, but back then I only kept track of the running total, achieving 2153 by the end of the year, with a daily max of 54
- Apparently, in 2020 my lifestyle changed dramatically with the pandemic, which in turn made the total yearly sneeze settle on lower values stably
- One could think the histograms should reflect a Poisson distribution, counting events in a fixed interval of time (a day), but this is not the case. Instead, the power law can be appreciated in Figure 6, clearly depicting a linearly decreasing trend with the logarithmic scale
- The median number of daily sneezes has steadily dropped to 0 after 2019, meaning that most days I don’t sneeze anymore
Posted by samuel_9521x
20 Comments
**Source**: Me. Since 2016, I’ve been logging my individual sneezes daily. **Tools**: Microsoft Excel
Can you explain what caused the rapid decline in sneezes in 2016-2020?
I was really expecting to see a chart showing the times you sneezed more than once in quick succession
This guy sneezes professionally.
What software are you using for these charts
why did you sneeze so much in 2016? what changed around that time that caused you to sneeze less?
How old are you? Did this significant decrease coincide with anything like graduating from school, changing jobs, etc?
I sneeze absolute tonnes, and now am just so curious about how you made this! If tou ever have the time, I’d love to know your methodology. Did you record the data in a notebook? Google forms? Notes app?
I believe you have sneezed more in one day than I have sneezed in total since 2016
considering a sneeze is a tenth of an orgasm, this guy must be loving life. how the hell is someone sneezing 1600 times a year
Wow, I’ve got to admire the ethic with recording sneezes for so long!
Congratulations! I know from experience how much dedication this takes.
I took part in the Oxford photic sneezing survey, where several hundred photic sneezers logged in every sneeze over a period of some months. The aim of the survey was to see what differences there are between sneezing caused by sudden exposure to bright light and random sneezes. I continued for the whole year and logged 930 for 2022.
why would you sort your graphs by the year instead of sorting by what you’re trying to show.
It basically makes it unreadable (for me at least)
For example: if you want to show how many sneezes you did per month, show the month of January and then the years next to each other. So you can see the impact of the specific month and year based on the amount of sneezes.
Now it’s just a bunch of graphs that can’t be read with a simple glance
I am missing a chart where we can see when the flu season / pollen season is and how good it matches your sneezes.
Cumulated over all the years
r/nosneeze idk if it still exists but this belongs here lol
i have a lot of respect for your commitment to accumulating this data over such a long period of time
do you log the sneeze as it happened?
Were you in Australia in 2016 when nature unleashed a pollen bomb?
[https://www.reddit.com/r/todayilearned/comments/1r642bx/](https://www.reddit.com/r/todayilearned/comments/1r642bx/)
I‘d suggest you make the colors gradient along the years so it‘s easier to see the chronology
do you have the “i have to sneeze once when getting out and the sunshine catches me”? (don’t know the scientific word for it)
Hitting my mid-30s, I now find most if my sneezes happen after plucking nose hairs. If you see a spike in a few years, that’ll be why.