
 Valuation After Recent Share Price Momentum")
With no single headline event driving the story, Cheniere Energy Partners (CQP) is attracting attention after a recent stretch of positive returns, including gains over the past week, month, and past 3 months.
See our latest analysis for Cheniere Energy Partners.
At a share price of $59.64, Cheniere Energy Partners’ recent momentum, including a 1 day share price return of 4.16% and a 90 day share price return of 13.36%, sits alongside a 5 year total shareholder return of 106.09%. This combination may suggest that investors are steadily reassessing both its income profile and the long term risk and reward trade off.
If this move in LNG interests you, it could be a good time to broaden your search with our screener of 25 power grid technology and infrastructure stocks as another way to spot energy infrastructure ideas.
With CQP now trading around $59.64 and sitting close to recent highs, you have to ask yourself: is the current price already reflecting its income profile and growth prospects, or is the market leaving a genuine buying opportunity on the table?
Price-to-Earnings of 15.5x: Is It Justified?
Cheniere Energy Partners is trading on a P/E of 15.5x, which sits below the broader US market but slightly above the US Oil and Gas industry average. The market therefore appears to be pricing its earnings somewhere between a sector premium and a wider market discount.
The P/E ratio compares the current share price to the company’s earnings per share. At 15.5x, you are effectively paying 15.5 years of current earnings for each unit of ownership. For a business tied to long term LNG contracts and infrastructure, this kind of earnings-based yardstick is a common way investors judge whether the income stream on offer feels reasonable.
Against the peer group, CQP screens as good value on a P/E basis compared to the peer average of 18.4x, even though it is described as expensive versus the broader US Oil and Gas industry at 14.5x. In addition, the estimated fair P/E of 20.1x is materially higher than the current 15.5x level. This indicates there is a gap between where the market is pricing CQP today and where that fair ratio model indicates the multiple could move toward if conditions line up.
Explore the SWS fair ratio for Cheniere Energy Partners
Result: Price-to-Earnings of 15.5x (ABOUT RIGHT)
However, you still need to weigh risks such as liquefied natural gas demand shifts, as well as any operational or contract issues tied to the Sabine Pass facility.
Find out about the key risks to this Cheniere Energy Partners narrative.
Another View: SWS DCF Model Points The Other Way
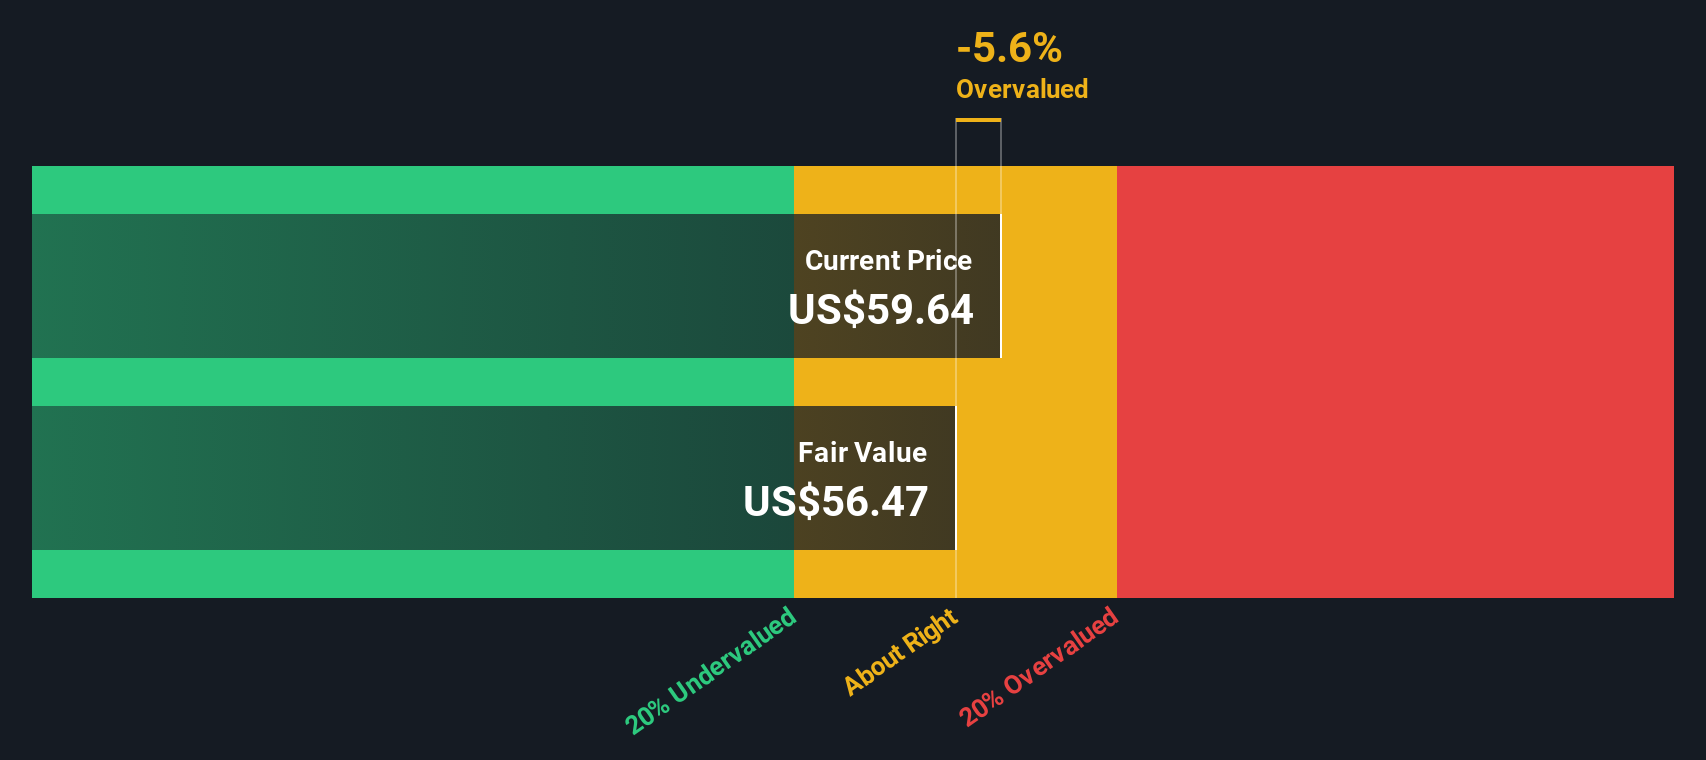
While the 15.5x P/E suggests Cheniere Energy Partners is not stretched compared to the wider US market, our DCF model tells a different story. On this view, the shares at $59.64 sit above an estimated future cash flow value of $56.47, which implies less margin for error if anything goes off script.
Look into how the SWS DCF model arrives at its fair value.
 CQP Discounted Cash Flow as at Feb 2026
Simply Wall St performs a discounted cash flow (DCF) on every stock in the world every day (check out Cheniere Energy Partners for example). We show the entire calculation in full. You can track the result in your watchlist or portfolio and be alerted when this changes, or use our stock screener to discover 55 high quality undervalued stocks. If you save a screener we even alert you when new companies match – so you never miss a potential opportunity.
Next Steps
Curious whether the balance of risks and rewards here really suits you? Take a moment to scan the data, weigh both sides, then use our breakdown of 1 key reward and 3 important warning signs to decide how it all stacks up for your own portfolio.
Ready to hunt for more ideas?
If CQP has sharpened your focus, do not stop here. Broaden your watchlist now so you do not miss other potential opportunities hiding in plain sight.
This article by Simply Wall St is general in nature. We provide commentary based on historical data
and analyst forecasts only using an unbiased methodology and our articles are not intended to be financial advice. It does not constitute a recommendation to buy or sell any stock, and does not take account of your objectives, or your
financial situation. We aim to bring you long-term focused analysis driven by fundamental data.
Note that our analysis may not factor in the latest price-sensitive company announcements or qualitative material.
Simply Wall St has no position in any stocks mentioned.
Our new AI Stock Screener scans the market every day to uncover opportunities.
• Dividend Powerhouses (3%+ Yield)
• Undervalued Small Caps with Insider Buying
• High growth Tech and AI Companies
Or build your own from over 50 metrics.
Have feedback on this article? Concerned about the content? Get in touch with us directly. Alternatively, email editorial-team@simplywallst.com