
![[OC] The Weight of a Life - Average Body Weight From Birth to 80 Years](https://www.byteseu.com/wp-content/uploads/2026/02/13lccastlbkg1-1536x1536.png "[OC] The Weight of a Life – Average Body Weight From Birth to 80 Years")
Source: CalculateQuick (visualization), CDC Growth Charts, NHANES 2015–2018.
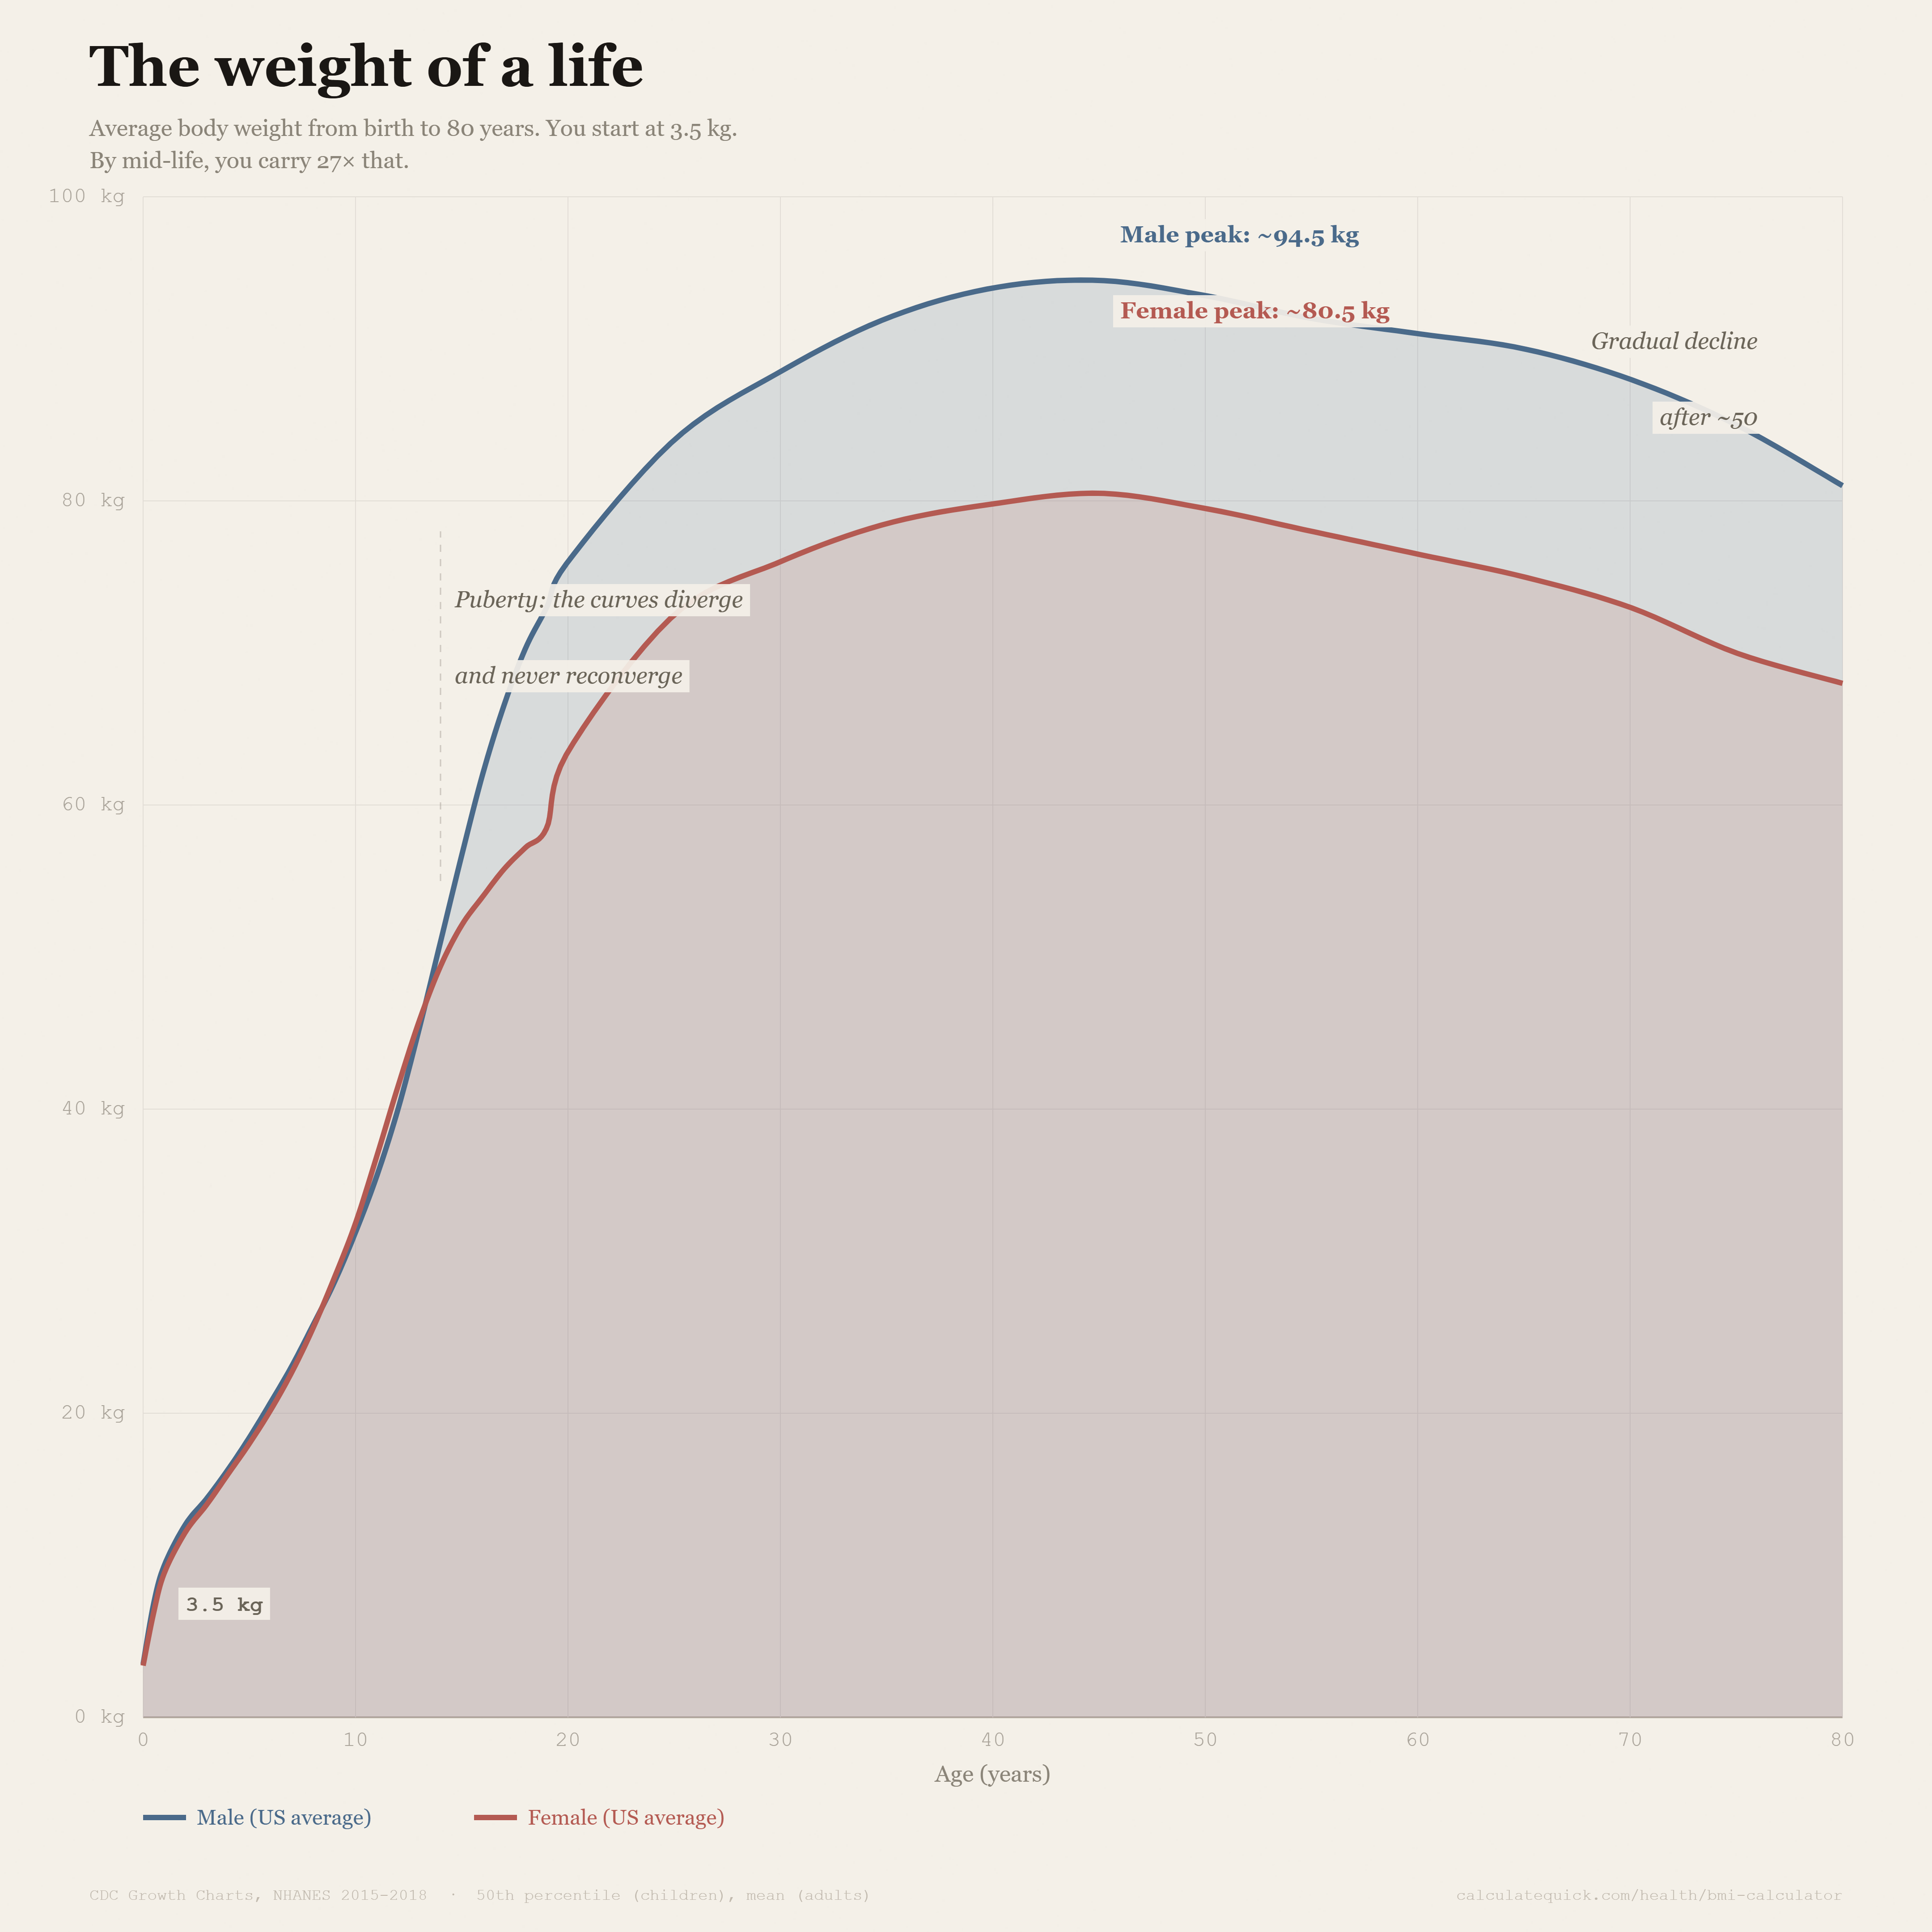
Tools: D3.js with area fills. 50th percentile for children, mean for adults. You start at 3.5 kg. By mid-life you carry 27× that. The curves diverge at puberty and never reconverge.
Posted by CalculateQuick
23 Comments
**Source:** [CalculateQuick](https://calculatequick.com/health/bmi-calculator/) (visualization), **CDC Growth Charts**, **NHANES 2015–2018**.
**Tools:** D3.js with area fills. 50th percentile for children, mean for adults. You start at 3.5 kg. By mid-life you carry 27× that. The curves diverge at puberty and never reconverge.
Is this adjusted for the difference in weight between generations? Eg. average height today is like 2 inches taller than a hundred years ago. The longer ago a person was born, the smaller they were all around, in general.
Average weight of that age of person in the population now, or average weight of a person as they mature and grow older?
That is much heavier than I thought it would be.
What is the country of reference?
95kg at peak for a man on average seems to be really fat to me
Both men and women reach their highest weight (on average) at 45? I’d have guessed at least 10 years older than that or even 20 years (~65 years of age).
What this data demonstrates is that overweight people start to die at a higher rate at around age 45. The average individual does not lose body mass as they get older.
Is the jump in women’s weights around 18 a biological truth or more of a social result from the freshman 15?
Someone please convert this to freedom units
Wow those are some high weights
“The curves diverge and never reconverge”. Don’t know why it felt so sad reading that lol
For other Americans:
94.5kg =208.337 lb
80.5kg =177.472 lb
That spike happening at what appear to be 18 years old for women seems off. I know society has made 18 the age of majority, but why would 18 cause a biological event?
It feels like a flaw in the underlying data(e.g. different surveys had to be conducted for under vs over 18 and sample size or other inconsistencies resulted in different numbers).
The CDC charts for women under 20 doesn’t seem to reflect that spike.
I’m sorry but “the curves diverge and never reconverge” is cracking me up
What, I am a woman?!?!!? (O___o)
Does this have selection bias as age increases?
I have the feeling that this has survivorship bias. Obesity is known as a risk factor for further diseases, specially atherosclerosis and heart problems.
Could it be that obese people are dying, and more advanced age is “thinner” because they are the ones that survive?
Oh neat! Few more years to peak, no reason to lose weight yet!
I wonder how this data handles survivor bias.
The fact that this is US average but in Kg is cursed as hell.
I wonder if the weight drop off with age is affected by higher weight people having a higher mortality.
This might be the average by age, but a typical person wouldn’t necessarily follow this curve
I feel like I’ve been around the same weight since high school 😅 I had some medicine that made me gain some weight one year, and dipped below that are I lost about 5 kg from illness another time, but I’m usually [my high school weight (±3 kg) ] ish. Never considered it was *that* unusual.
Crazy how fast it continues to grow post puberty. Was expecting it to flatten dramatically once puberty ends. It really captures the mid 20s slowing metabolism induced fatness that’s so common
The axis labels sure as fick aren’t beautiful