Data Source: Billboard Hot 100 Historical Data (via utdata/rwd-billboard-data) combined with custom API extractions from MusicBrainz and TheAudioDB for granular genre and artist metadata.
Tools: R (ggplot2)
Methodology:
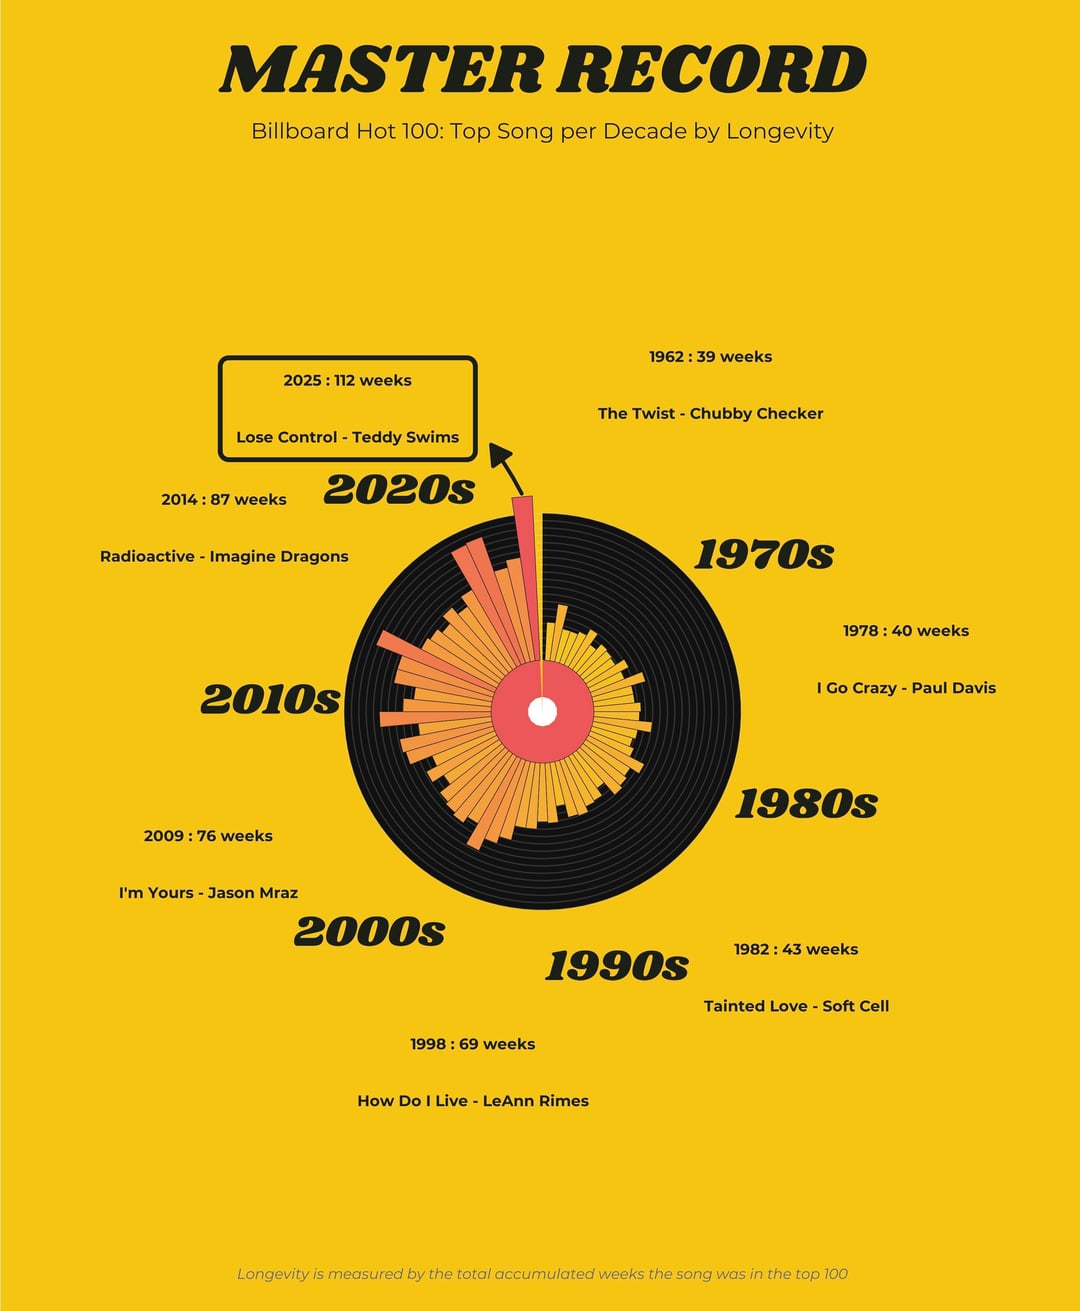
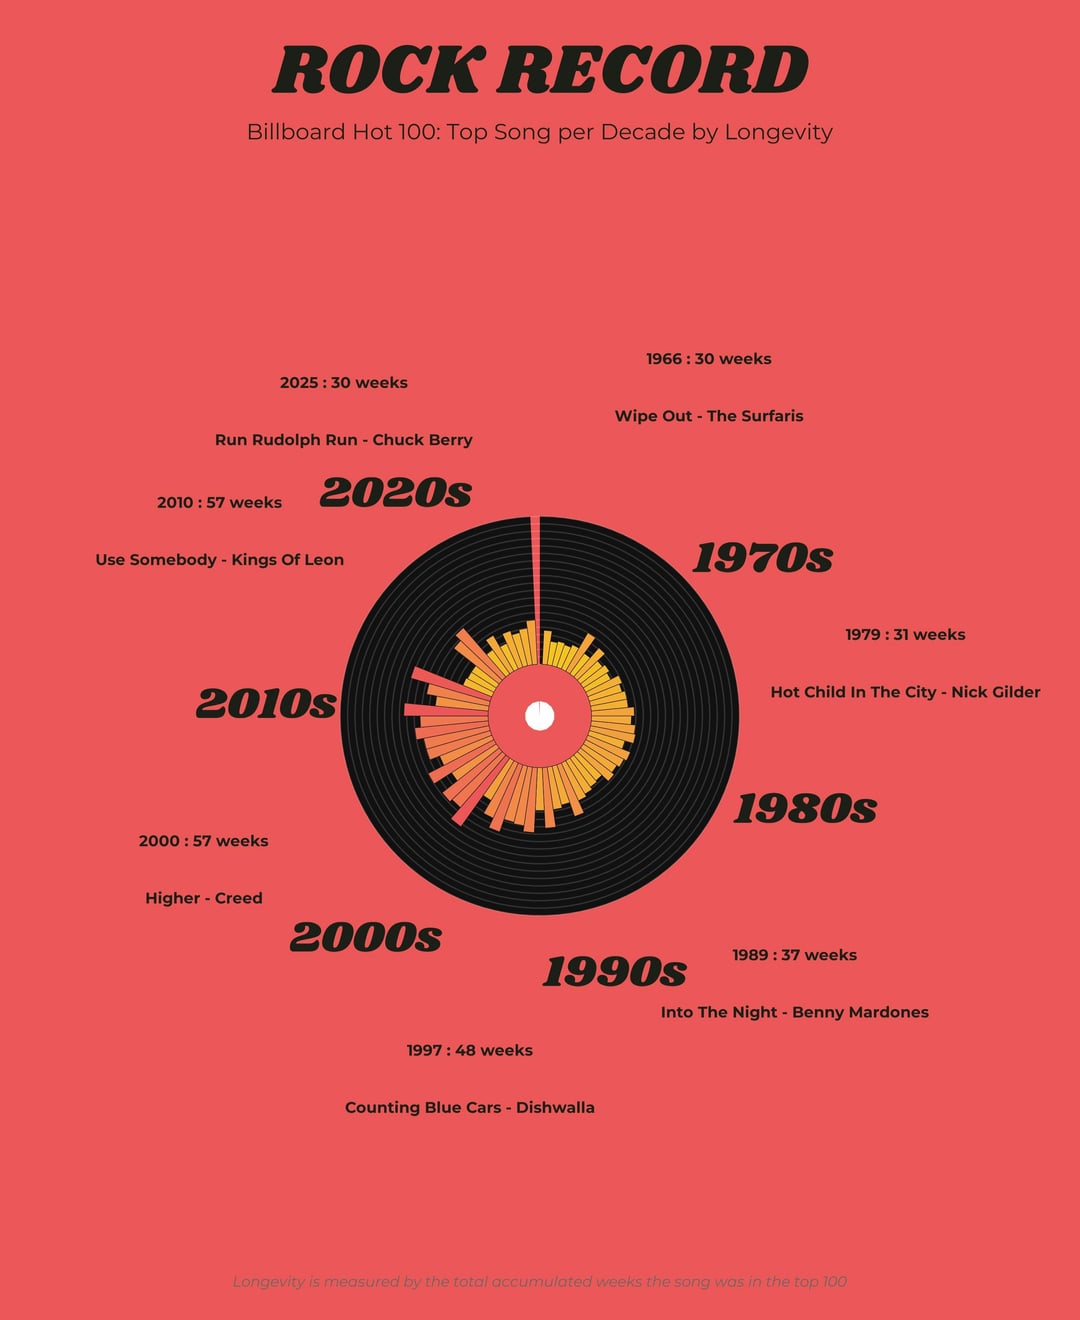
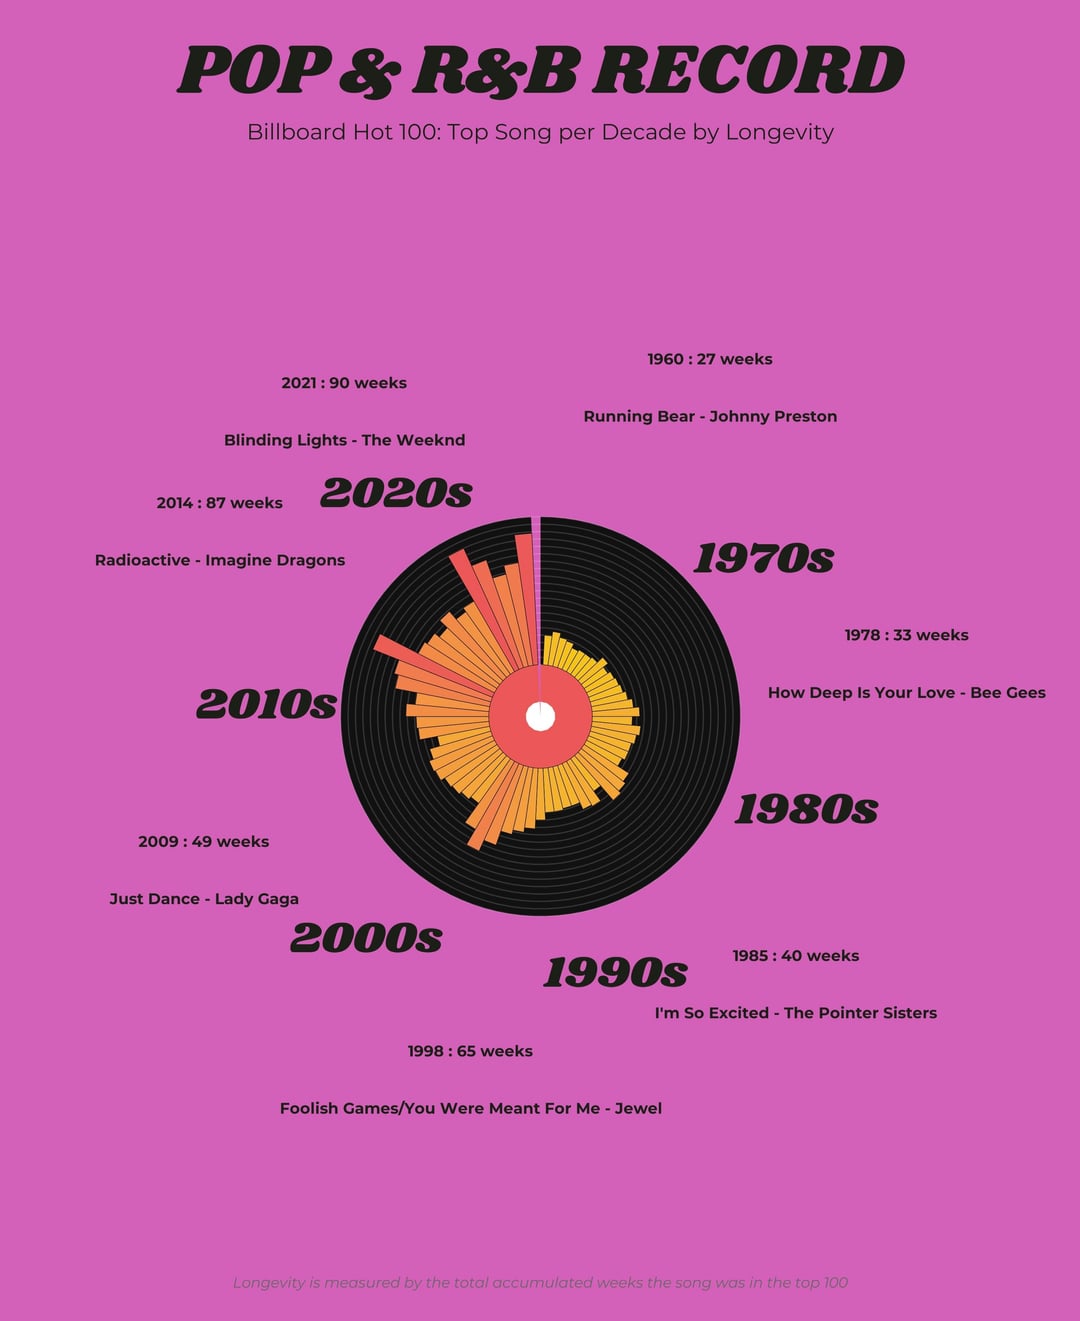
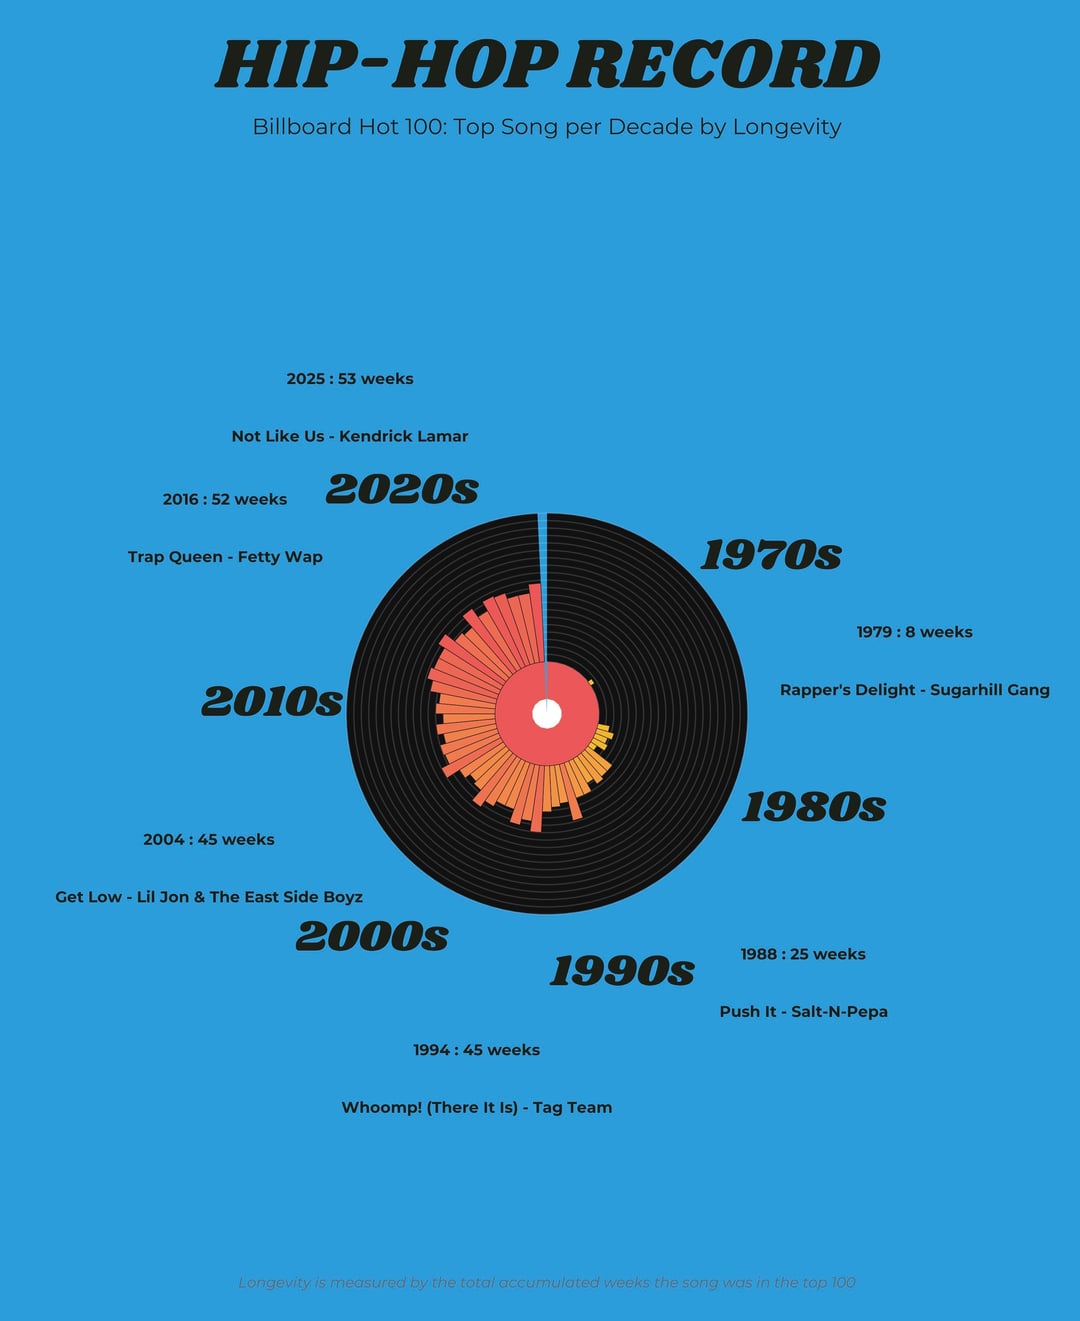
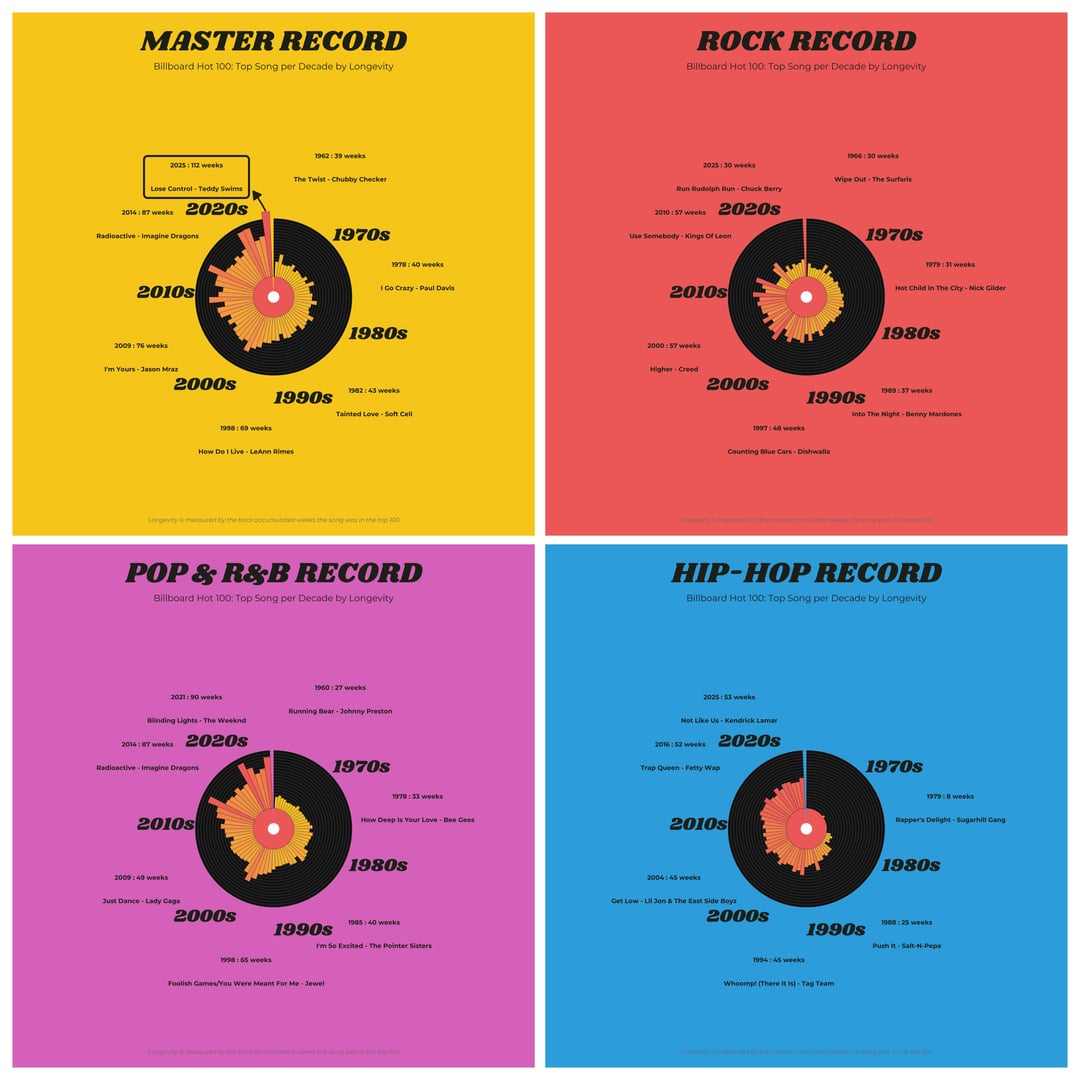
– Metric: “Longevity” is defined as the total cumulative weeks a song spent on the Hot 100 chart.
Key Insight:
You can clearly see the “streaming era” effect in the outer rings (2020s), where songs linger on charts significantly longer than they did in the 70s or 80s due to how streaming counts toward chart performance.

![[OC] The Longest-Charting Billboard Hot 100 Song of Every Decade (1960–2025)](https://www.byteseu.com/wp-content/uploads/2026/02/pwzgpraf1klg1-844x1024.jpg "[OC] The Longest-Charting Billboard Hot 100 Song of Every Decade (1960–2025)")
5 Comments
Data Source: Billboard Hot 100 Historical Data (via utdata/rwd-billboard-data) combined with custom API extractions from MusicBrainz and TheAudioDB for granular genre and artist metadata.
Tools: R (ggplot2)
Methodology:
– Metric: “Longevity” is defined as the total cumulative weeks a song spent on the Hot 100 chart.
Key Insight:
You can clearly see the “streaming era” effect in the outer rings (2020s), where songs linger on charts significantly longer than they did in the 70s or 80s due to how streaming counts toward chart performance.
If you want to see the full high resolution chart you can find it on my GitHub here: [Evolution of Mainstream Music: Billboard Hot 100](https://github.com/armin-talic/Evolution-of-Mainstream-Music-Billboard-Hot-100)
Damn shame that rock has fallen off so hard
I don’t think anyone would have any of these songs as the “best” of their respective decades.
I assumed you had a mistake in your graphic when I saw Chuck Berry on the rock chart for the 2020s. Had no clue it charted again in 2020-2021
Confusing layout. What do the starbursts in the middle of the records represent? What are the differences between the four charts?