

A newly published sociology study from the University of Wisconsin-Madison found white disadvantaged neighborhoods shifted right politically, while advantaged neighborhoods shifted left in the past few decades.
President Trump’s ascendancy relied on a strong base of economically disadvantaged, majority-white voters. In an era where employees often work far from home, this UW-Madison study explored the intersection of class and politics beyond neighborhood-level economics, classifying neighborhoods based on both economic prosperity and where people commute.
Published earlier this month, the study was conducted by Meghann Norden-Bright and Karl Vachuska, 3rd and 4th-year PhD students.
Mobility patterns show how political polarization has intensified
To measure socioeconomic status, the authors intertwined two variables.
Residential neighborhood disadvantage (RND) measured social disadvantage, based on factors like percentage of poverty, unemployment and single-headed households. Meanwhile, mobility-based neighborhood disadvantage (MND) combined the RND measure with cellphone location data to reflect where residents traveled, as well as who visited their neighborhoods.
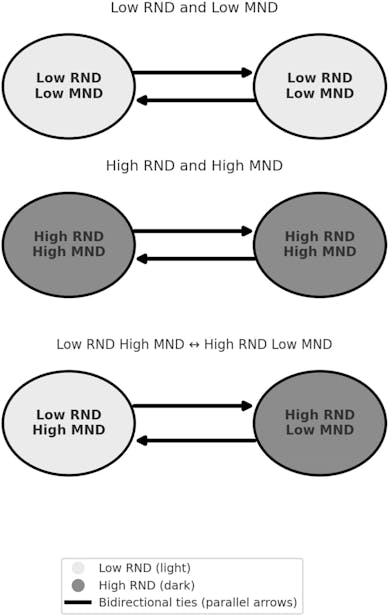
A chart demonstrating how mobility-disadvantaged neighborhoods are determined.
The general trend showed that low MND white neighborhoods connected to more affluent neighborhoods typically cast fewer Republican votes, compared to high MND white neighborhoods connected to economically disadvantaged neighborhoods. Mobility-based disadvantage predicted voting behavior better than residential disadvantage alone.
“When we’re trying to get at questions of political polarization in neighborhoods, voting data is just the most obvious thing to look at,” Norden-Bright said. ”If we try to measure and capture disadvantages in a local context, that gives us a better understanding of how these polarization patterns are happening.”
When mapped over eight years, the disparity between high and low MND voting patterns grew rapidly.
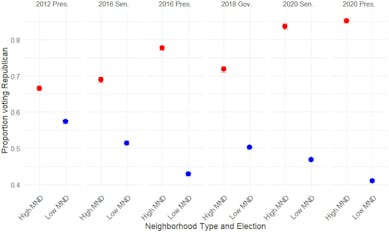
Marginal predictions of proportion of Low MND (red) and High MND (blue) 100% White neighborhoods voting Republican.
Enjoy what you’re reading? Get content from The Daily Cardinal delivered to your inbox
“[MND] wasn’t even really an axis [of neighborhood disadvantage] back in the 2012 election,” Vachuska said. “But fast forward through 2016 and 2020, and all of a sudden it’s this really dominant explanatory factor in how people across space vote differently.”
In the 2012 presidential election, voters in high and low MND neighborhoods voted similarly along partisan lines, differing by a gap of less than 10% of votes. By 2016, that gap widened to 35%, with three-quarters of votes in mobility-disadvantaged neighborhoods going to Trump. By 2020, there was a 40% gap in partisanship between the most mobility-disadvantaged and the most mobility-advantaged neighborhood.
The gap was smaller in the 2018 gubernatorial and 2020 Senate election cycles than it was in the 2016 presidential elections, suggesting Trump may have outsized influence on polarization. But when comparing Senate and gubernatorial trends alone, the differences were still wider than the 2016 Senate elections.
“The extent to which we were able to see [polarization] picking up in 2016 with the presidential election, and then diffusing down to more downstream elections in following years, was an interesting pattern that I didn’t expect to see play out,” Norden-Bright said.
The 2020 presidential election represented the most polarized voting patterns out of all the elections measured; 85% of votes from mobility-disadvantaged white neighborhoods went to Trump as opposed to only 41% of votes in mobility-advantaged white neighborhoods.
This polarized pattern also tracked for the 2020 Senate elections, where 84% of votes in high NMD white neighborhoods went to Republican candidates compared to 47% in low NMD white neighborhoods. The authors said the similarly sized gaps between the presidential and Senate elections display wider party division stemming from polarization around Trump.
Stronger results than researchers expected
“I was expecting our hypothesis regarding [mobility-based] neighborhood disadvantage to serve as this axis of polarization,” Vachuska said. “I was surprised by how strong it was, and what I was even more surprised by the fact that it’s really just emerged since 2012, basically.”
Economic disadvantage is considered a major factor in the shift of white voters to Republican candidates in the past decade. However, the authors said most metrics used to estimate economic disadvantage rely largely on where individuals live — the average income, employment and education levels in their neighborhoods.
Norden-Bright and Vachuska said this over-simplified view of economic disadvantage doesn’t take into account mobility patterns, where individuals go in their day-to-day lives and who they interact with.
The researchers used cell phone location data, provided via third party brokers such as SafeGraph, to estimate mobility.
“The data we get is this neighborhood-level aggregated data [of]: what other neighborhoods do people who live in this neighborhood visit?” Vachuska said.
Building off the results of a 2016 presidential election study, the authors focused on predominantly white neighborhoods for their analysis, citing the wider variation in socioeconomic status compared to non-white neighborhoods and white voters displaying the greatest overall partisan swing nationally.
Vachuska and Norden-Bright used a regression model to measure relationships between mobility-based disadvantage and Republican vote shifting over several election cycles, starting with the 2012 presidential election and ending with the 2020 presidential election.
“These patterns of political polarization map really strongly, and that’s going to be increasingly important as we sort of look at ways for addressing political polarization and potential downstream negative effects [of it],” Vachuska said.
The Daily Cardinal has been covering the University and Madison community since 1892. Please consider giving today.