Get insights on thousands of stocks from the global community of over 7 million individual investors at Simply Wall St.
-
Wondering whether PENN Entertainment at around US$15.64 is a bargain or a value trap? This article walks through what the current price might be implying.
-
The share price has moved sharply in the short term, with a 20.1% return over the last 7 days and 18.0% over the last 30 days. However, the 1 year return of 27.3% and 3 year return of 49.8% show a very different picture.
-
These swings come as investors continue to reassess PENN Entertainment’s position in the US gaming and entertainment sector, including how its physical properties and interactive businesses fit together. Broader sentiment toward consumer services stocks and changing views on risk are helping to frame how the market is currently treating the shares.
-
On our valuation checks, PENN Entertainment scores 5 out of 6. Next we will walk through the main valuation methods behind that result and finish by looking at a richer way to think about the company’s value beyond a single score.
Find out why PENN Entertainment’s -27.3% return over the last year is lagging behind its peers.
A Discounted Cash Flow, or DCF, model estimates what a company might be worth today by projecting its future cash flows and then discounting those back to the present using a required return.
For PENN Entertainment, the model used is a 2 Stage Free Cash Flow to Equity approach, based on cash flow projections in $. The latest twelve month free cash flow is a loss of $11.94 million. Analysts provide forecasts out to 2027, including free cash flow of $396.67 million in 2027, and Simply Wall St extends this with its own estimates out to 2035, reaching projected free cash flow of $1.84 billion in that year.
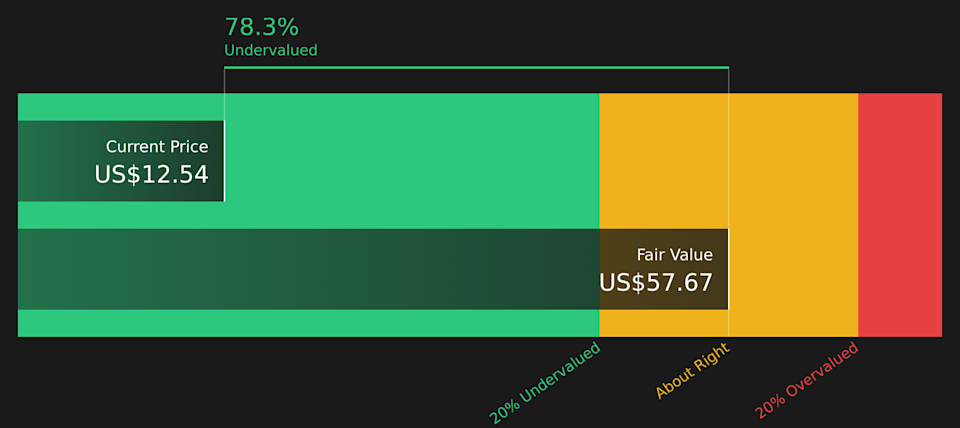
After discounting this stream of projected cash flows back to today, the model arrives at an estimated intrinsic value of about $87.67 per share. Compared with the recent share price of roughly $15.64, the DCF output suggests the stock is around 82.2% below that estimate. On this basis, PENN Entertainment screens as materially undervalued using this method.
Result: UNDERVALUED
Our Discounted Cash Flow (DCF) analysis suggests PENN Entertainment is undervalued by 82.2%. Track this in your watchlist or portfolio, or discover 46 more high quality undervalued stocks.
PENN Discounted Cash Flow as at Feb 2026
Head to the Valuation section of our Company Report for more details on how we arrive at this Fair Value for PENN Entertainment.
For companies where earnings can be volatile or negative, the P/S ratio is often a practical way to compare what the market is paying for each dollar of revenue. It sidesteps near term profit swings and focuses on the top line that ultimately needs to support future profits.
In general, higher growth expectations and lower perceived risk can justify a higher “normal” or “fair” P/S multiple, while slower growth or higher risk tend to point to a lower multiple. That context helps when you compare PENN Entertainment’s current P/S of 0.31x with the Hospitality industry average of 1.61x and a peer group average of 1.83x.
Simply Wall St’s Fair Ratio for PENN Entertainment is 1.06x. This is a proprietary estimate of what a reasonable P/S could be, based on factors such as earnings growth, industry, profit margins, market cap and company specific risks. Because it blends these elements, the Fair Ratio can be more tailored than a simple comparison to industry or peers.
With the current P/S at 0.31x, compared with a Fair Ratio of 1.06x, the shares screen as undervalued on this metric.
Result: UNDERVALUED
NasdaqGS:PENN P/S Ratio as at Feb 2026
P/S ratios tell one story, but what if the real opportunity lies elsewhere? Start investing in legacies, not executives. Discover our 19 top founder-led companies.
Earlier we mentioned that there is an even better way to understand valuation. Simply Wall St’s Narratives let you attach a clear story to your numbers by linking your view of PENN Entertainment’s future revenues, earnings and margins to a financial forecast and fair value, then comparing that fair value to today’s price. All of this happens inside an easy Community page tool that updates as new news or earnings arrive. One PENN Narrative might argue that solid casino fundamentals and a write off of past mistakes support a fair value of about US$79.65 per share. Another, more cautious Narrative might focus on regulatory pressures, competition and execution risk and arrive closer to US$15 per share. This gives you a transparent range of views to benchmark your own perspective against.
For PENN Entertainment, here are previews of two leading PENN Entertainment narratives to make comparison easier:
🐂 PENN Entertainment Bull Case
Fair value in this bull case: US$79.65 per share
Implied discount to this fair value at US$15.64: about 80.4%
Revenue growth assumption used in this narrative: 354.0%
-
Views PENN as a beaten down operator with solid casino fundamentals, where past missteps and write offs are already reflected in the valuation.
-
Highlights a business with roughly US$7.0b in revenue and US$1.7b in EBITDAR, suggesting the physical assets and scale remain important to the story.
-
Frames upside around a potential re rating of earnings, with fair value anchored to a multiple of 2027 EBITDA to enterprise value.
🐻 PENN Entertainment Bear Case
Fair value in this bear case: US$15.00 per share
Implied premium to this fair value at US$15.64: about 4.1%
Revenue growth assumption used in this narrative: 306.5%
-
Focuses on regulatory pressure, competition and financial risk as headwinds for revenue growth, margins and long term profitability.
-
Questions how effectively PENN can scale its interactive and omnichannel offerings against larger digital rivals and changing customer habits.
-
Ties the cautious view to analyst fair value cuts and a lower future P/E multiple, even as some forecasts factor in higher profit margins and ongoing buybacks.
If you want to move beyond these previews and see the full arguments on each side, including the detailed assumptions behind the cash flow, margins and valuation work, you can start with the community narratives for PENN and then stress test them against your own expectations for the business.
Curious how numbers become stories that shape markets? Explore Community Narratives
Do you think there’s more to the story for PENN Entertainment? Head over to our Community to see what others are saying!
NasdaqGS:PENN 1-Year Stock Price Chart
This article by Simply Wall St is general in nature. We provide commentary based on historical data and analyst forecasts only using an unbiased methodology and our articles are not intended to be financial advice. It does not constitute a recommendation to buy or sell any stock, and does not take account of your objectives, or your financial situation. We aim to bring you long-term focused analysis driven by fundamental data. Note that our analysis may not factor in the latest price-sensitive company announcements or qualitative material. Simply Wall St has no position in any stocks mentioned.
Companies discussed in this article include PENN.
Have feedback on this article? Concerned about the content? Get in touch with us directly. Alternatively, email editorial-team@simplywallst.com

 Attractively Priced After Recent 20% Weekly Share Price Jump?")