
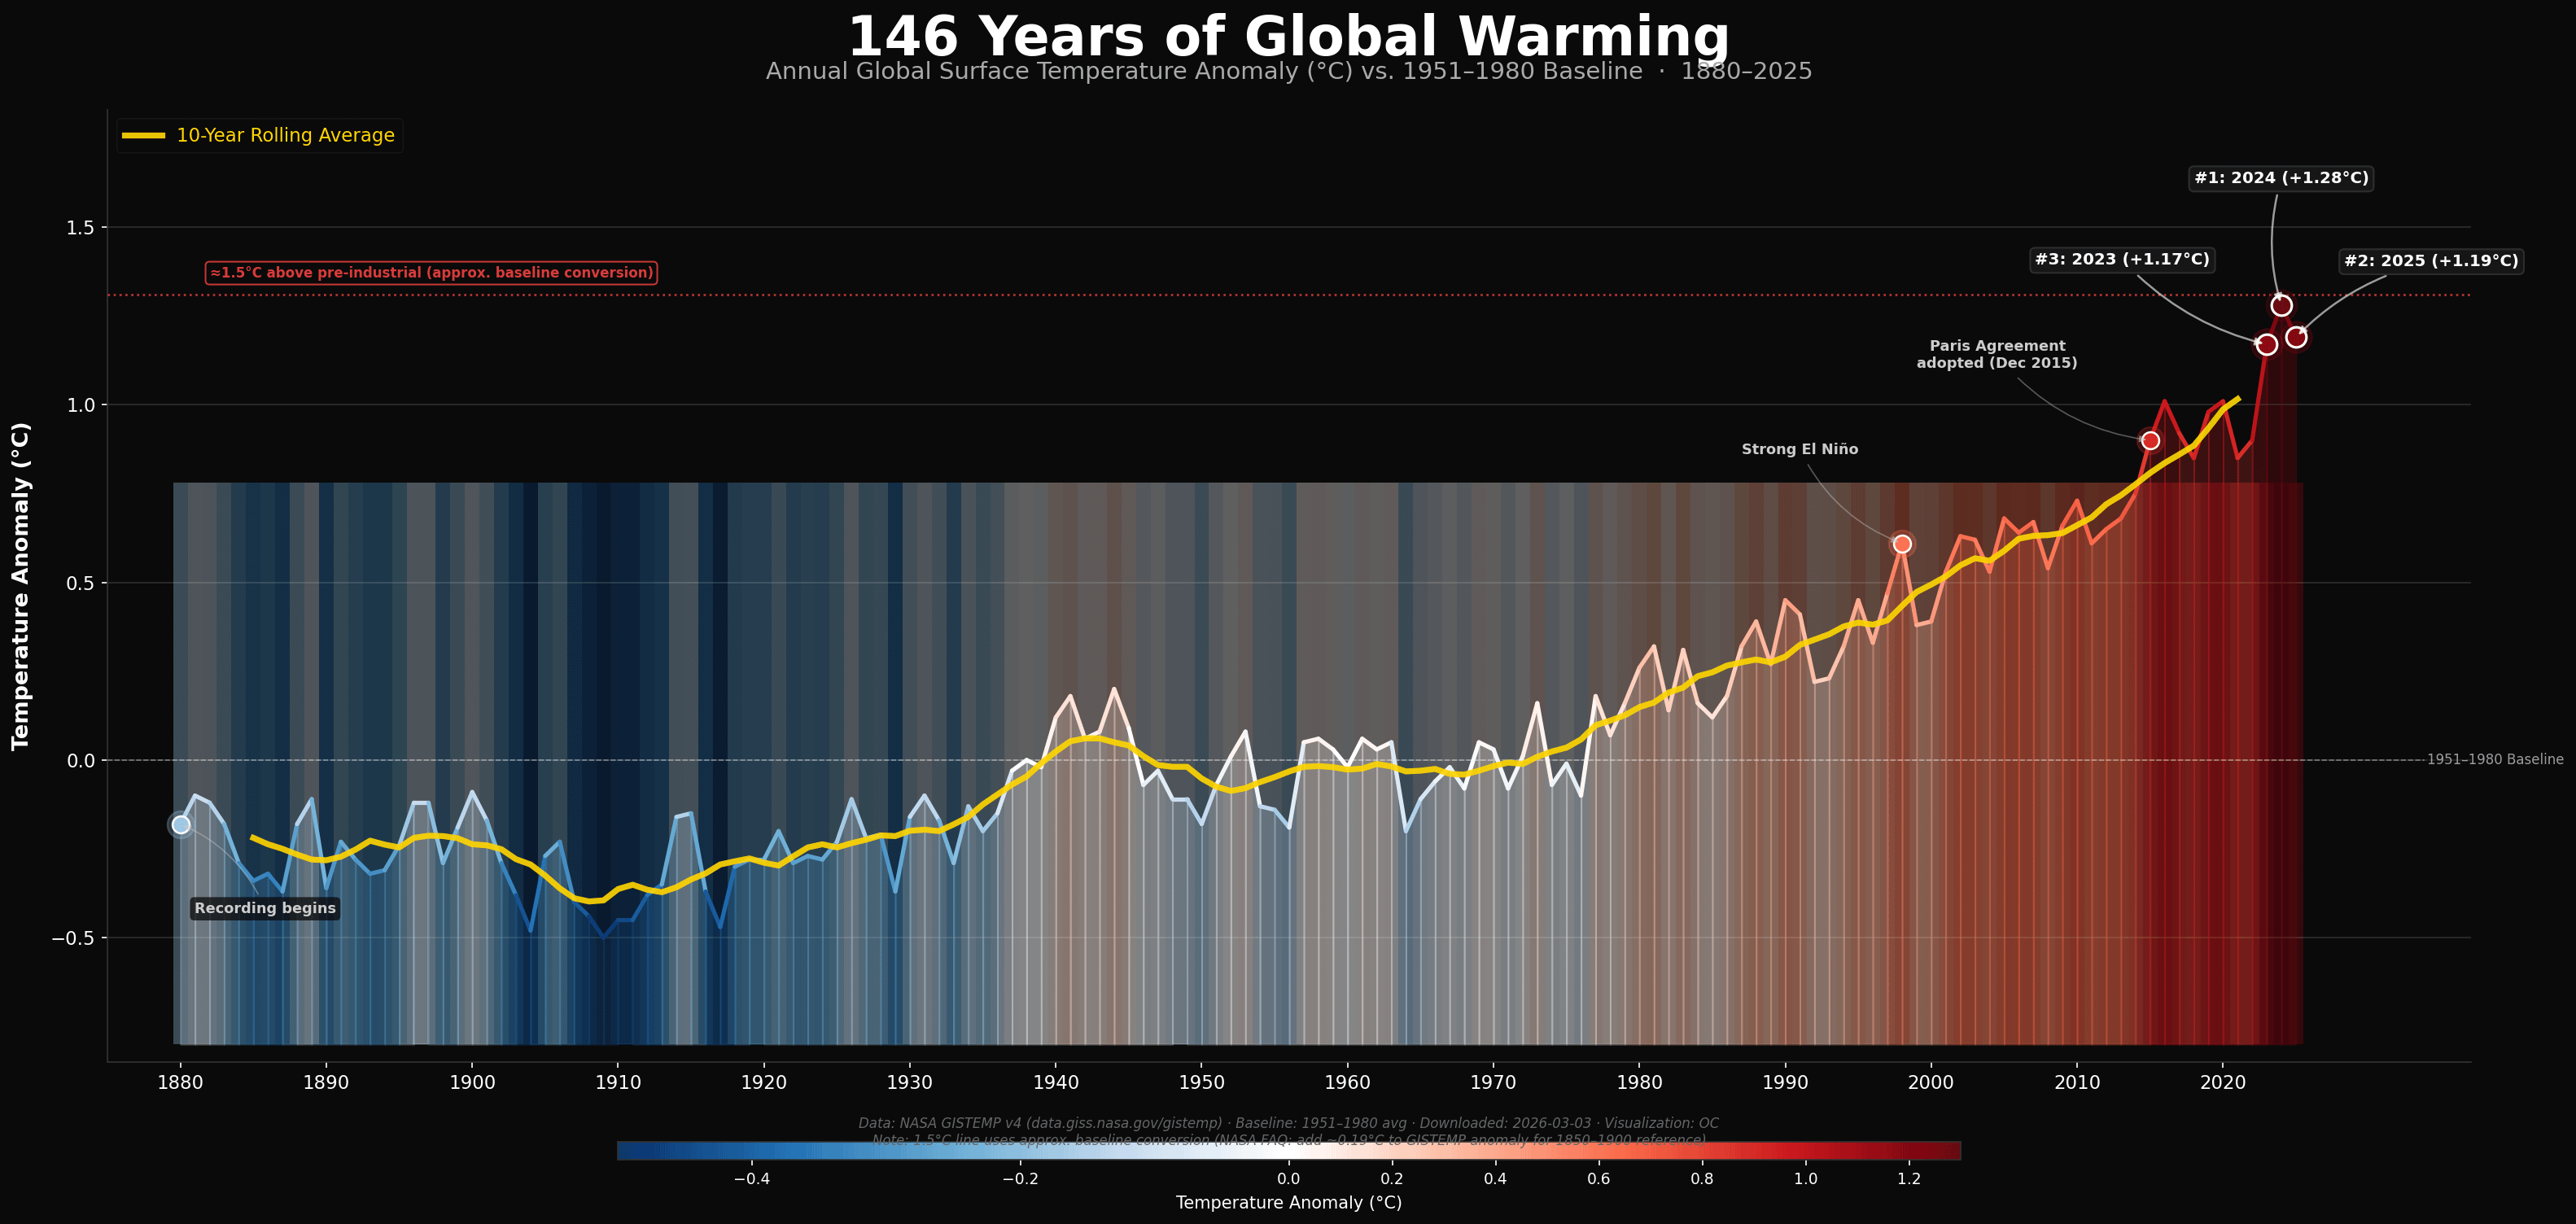
![[OC] 146 Years of Global Warming: Every year's temperature since 1880, colored by anomaly. 2025, 2024, and 2023 are the three warmest years in NASA's entire record.](https://www.byteseu.com/wp-content/uploads/2026/03/1e7v96kuoqmg1-1536x730.png "[OC] 146 Years of Global Warming: Every year’s temperature since 1880, colored by anomaly. 2025, 2024, and 2023 are the three warmest years in NASA’s entire record.")
Source & Methodology
• Data: NASA GISTEMP v4 — downloaded directly from data.giss.nasa.gov/gistemp on 2026-03-03
• Baseline: Anomalies are relative to the 1951–1980 global average (NASA's standard baseline)
• Tool: Python (matplotlib + pandas), run in Google Colab.
• Key context from NASA press releases:
2024: +1.28°C — warmest year on record (NASA, Jan 10, 2025)
2025: +1.19°C — effectively tied with 2023 as 2nd warmest (NASA, Jan 14, 2026)
2024's record followed 15 consecutive months of monthly temperature records (Jun 2023–Aug 2024)
• 1.5°C threshold line note: The dashed red line shows ≈1.5°C above pre-industrial (1850–1900). Converting between baselines is approximate — NASA's FAQ (as of Jan 2025) says you can add ~0.19°C to a GISTEMP anomaly to approximate the anomaly relative to 1850–1900. So 1.5°C pre-industrial ≈ 1.31°C in GISTEMP units. This conversion may shift slightly as methodology evolves.
• Paris Agreement: Adopted Dec 12, 2015 at COP21; entered into force Nov 4, 2016. Annotated at 2015.
• Top 3 warmest years are computed dynamically from the dataset — not hardcoded. If NASA revises the data, the chart updates automatically.
• Citation: GISTEMP Team, 2025: GISS Surface Temperature Analysis (GISTEMP), version 4. NASA Goddard Institute for Space Studies. Lenssen et al. (2024), J. Geophys. Res. Atmos., 129(17), e2023JD040179.
Posted by labubugotmyheart
1 Comment
It’s painfully obvious humans are gonna do nothing about this because we are psychologically incapable of planning ahead.
I am so glad I’m gonna die in 30 years before the water wars start lol