
Possibly one factor in the impact of oil shocks (although Blanchard and Gali (2007) place greater weight on greater wage flexibility and central bank credibility):
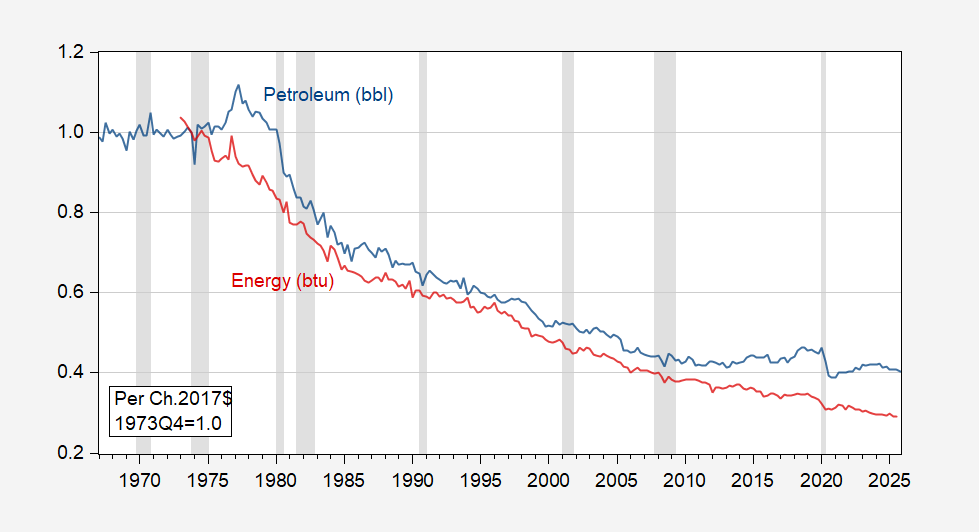
Figure 1: Petroleum intensity of real GDP (blue), and energy intensity of real GDP (red), normalized 1973Q4=1. Petroleum is in billions of barrels. Energy is sum of residential, commercial and industrial production, plus transportation production, in trillions of BTU. NBER defined peak-to-trough recession dates shaded gray. Source: EIA, BEA 2025Q4 second release.
This entry was posted on March 15, 2026 by Menzie Chinn.