

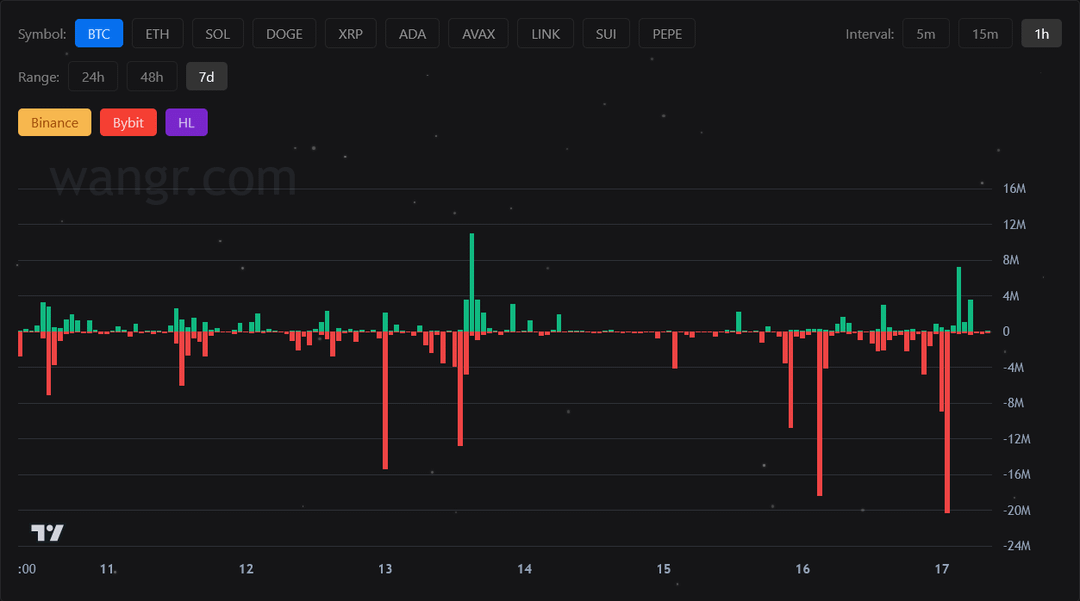
Long liquidations are green (upwards), short liquidations are red (downwards).
What's interesting is that last big red bar for shorts. That actually happened within ~3 minutes during the pump a few hours ago.
But needless to say, I guess this past week, the pain has turned around and shorts are getting the brunt of it after having really coasted for a while.
Pretty insane.
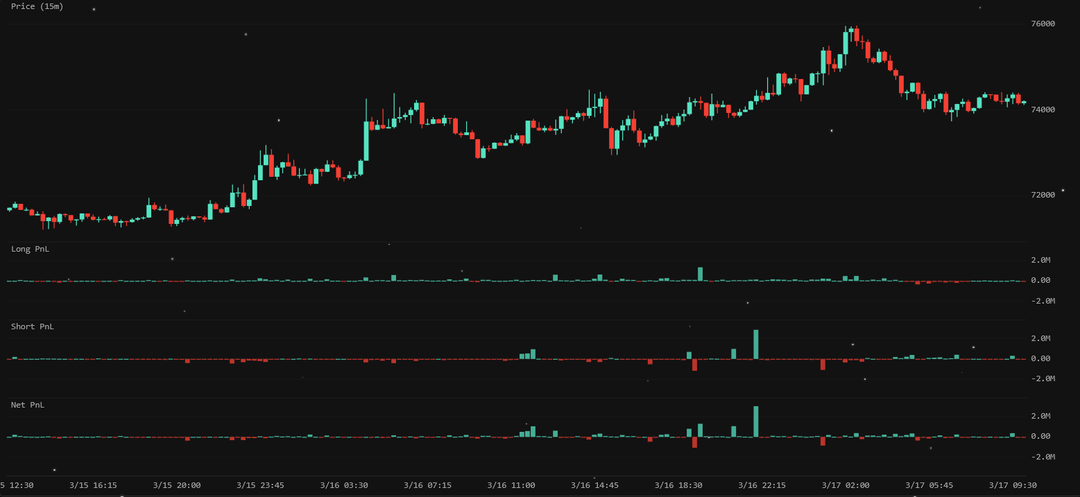
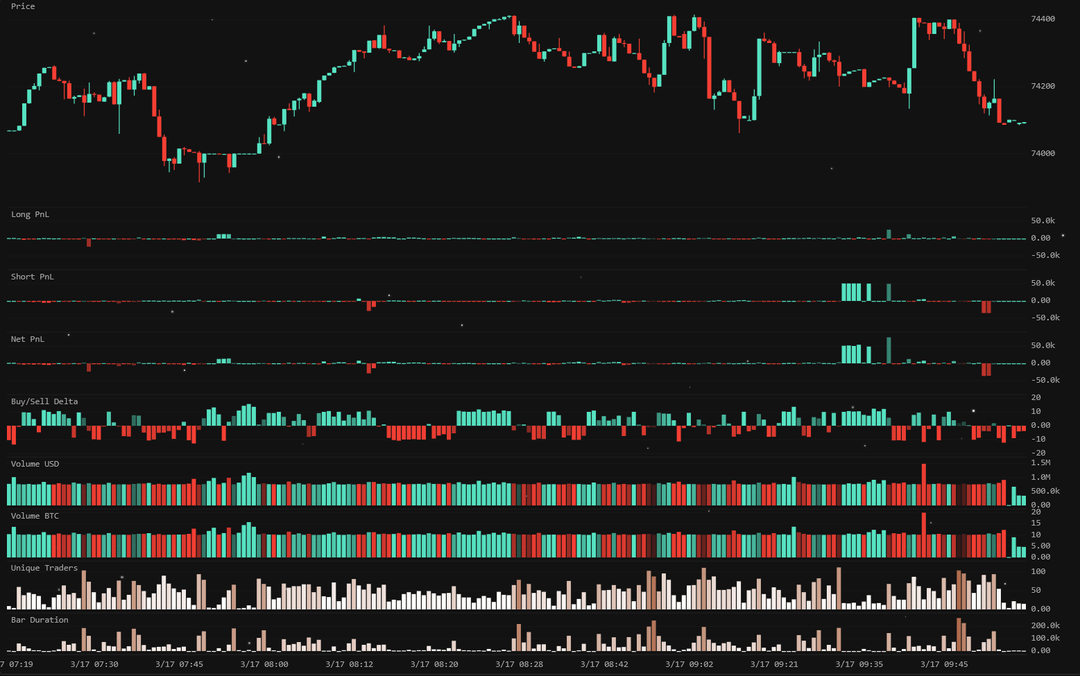
On the second and third chart you may notice that Shorts are starting to take profits on their long held positions. I see this as maybe the best sign yet.
Getting scared.
Or what do you think?
I rather see the smart whales taking profits and covering than dumb high leverage whales get liquidated with yolo money
https://www.reddit.com/gallery/1rw1f75
2 Comments
Fomc is tomorrow, looking at the past, you all know what’s going to happen.
What charting software/website are you using for that data? Where can I get those indicators?