
-
Climate Central’s new global analysis shows where people felt the strongest influence of human-caused climate change on daily average temperatures between December 2025 and February 2026.
-
Every day from December 2025 to February 2026, more than one in six people on the planet experienced temperatures made at least two times more likely by climate change.
-
The U.S. experienced a strong divide. Western states experienced exceptional and record-breaking winter warmth driven by climate change. Eastern states experienced near-average or below-average seasonal temperatures and extreme cold snaps that are less likely to occur in our warming climate.
-
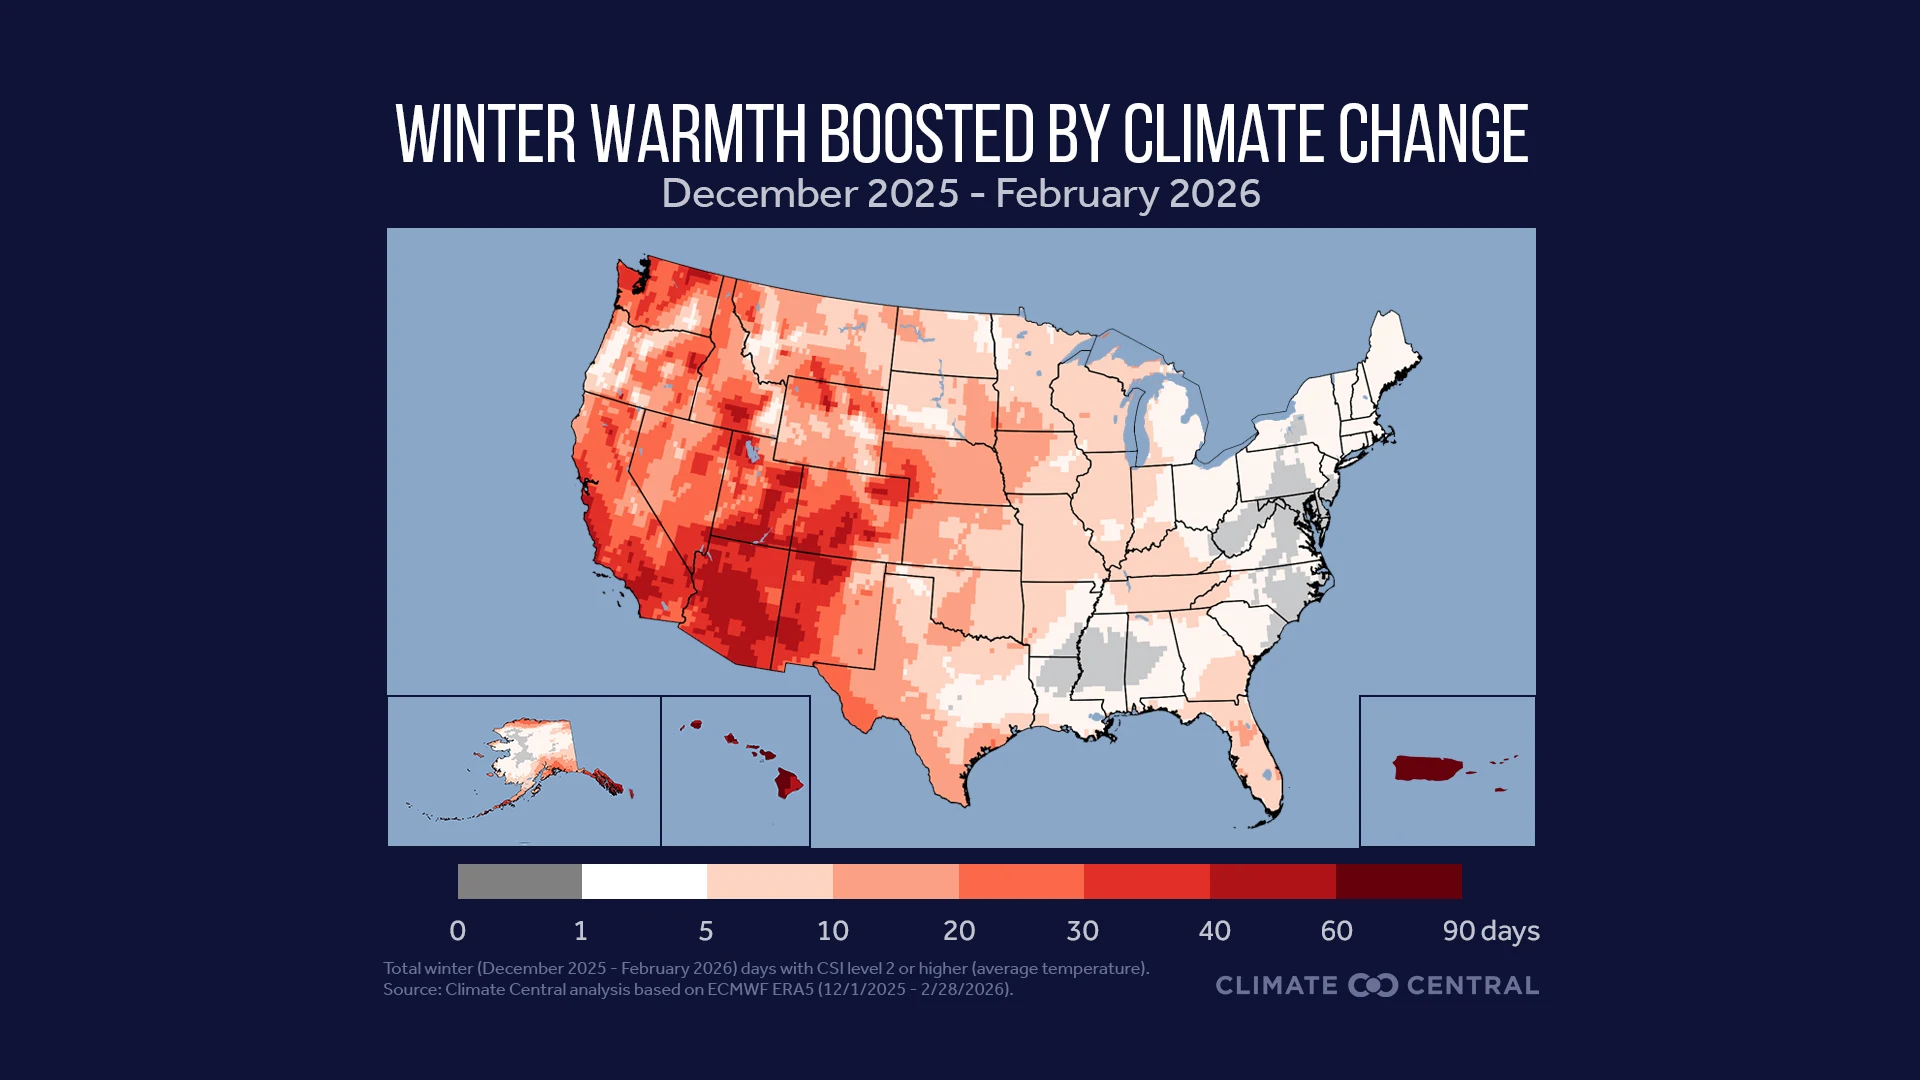
In 54 U.S. cities, mostly in the western U.S., the average resident experienced at least two weeks’ worth of temperatures made at least two times more likely by climate change.
This Climate Matters analysis is partly based on open-access data from the National Oceanic and Atmospheric Administration (NOAA). See Methodology for details.
Global fingerprints of climate change: December 2025 to February 2026
Heat-trapping pollution (mainly from burning coal, oil, and methane gas) influenced temperatures in nearly all regions of the world during the past three months.
Every day from December 2025 to February 2026, more than one in six people on the planet experienced temperatures made at least two times more likely by climate change.
That’s according to Climate Central’s latest report, People Exposed to Climate Change: December 2025 to February 2026.
This analysis used Climate Central’s Climate Shift Index (CSI) system to quantify the influence of human-caused climate change on daily average temperatures around the world from December 1, 2025, to February 28, 2026. See Methodology for details.
-
Explore interactive maps with data for 252 countries and 960 cities (including 247 U.S. cities).
A CSI level 2 (3, 4, etc.) indicates local temperatures that were made at least two (three, four, etc.) times more likely due to climate change. Negative CSI levels indicate local temperatures that were made less likely due to climate change.
-
Learn more about the CSI: explore the CSI map tool, watch a video explainer, or read about attribution science.
 Click the downloadable graphic: Winter 2025-2026 CSI Summary
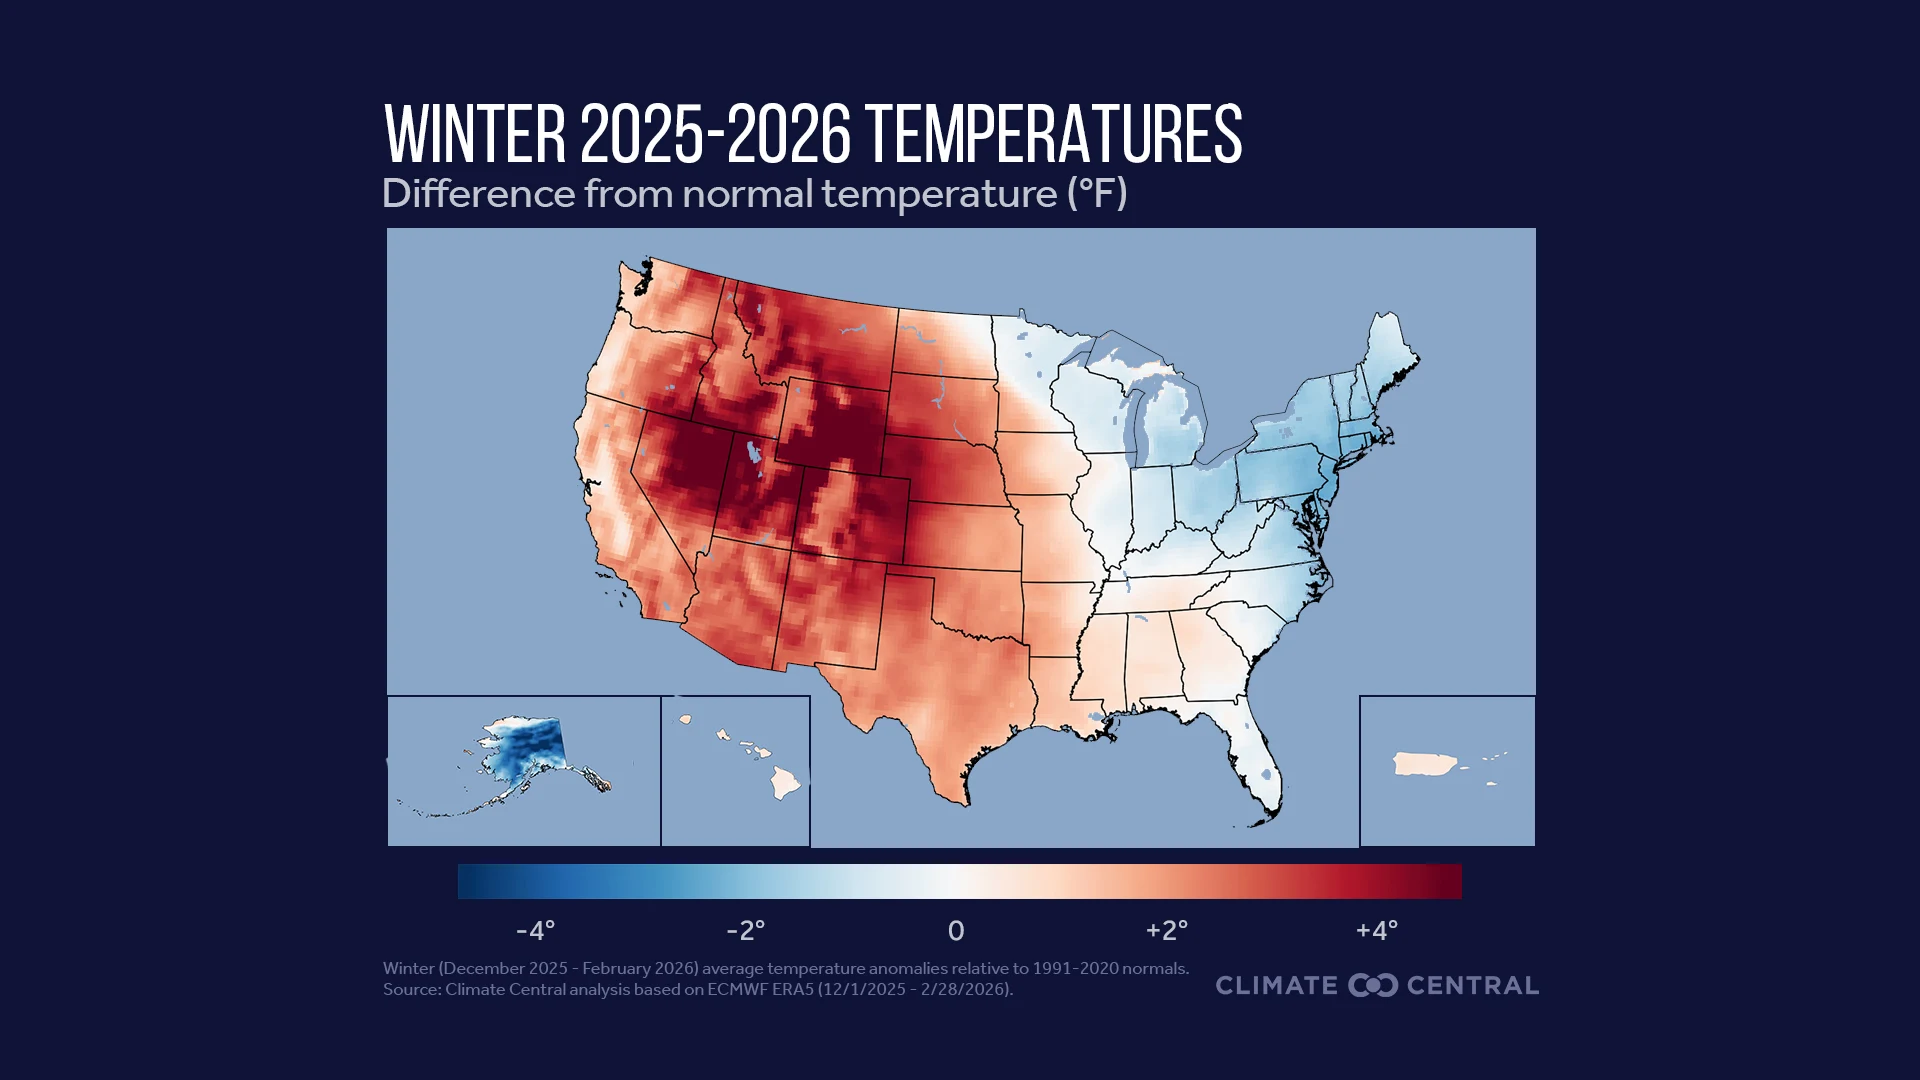 Click the downloadable graphic: Winter 2025-2026 TemperaturesClimate change drove exceptional winter warmth in the western U.S.
The western U.S. experienced exceptional warmth this past winter (December 2025 through February 2026).
-
Nine western states experienced their warmest December-February on record.
-
According to Climate Central’s analysis, average temperatures over the past three months in Wyoming, Colorado, Montana, and Utah were more than 7°F above normal. Wyoming topped the list at 9.3°F above normal.
-
This western U.S. warmth stood out globally. Among the 960 global cities analyzed, 13 of the top 15 cities with the highest temperature anomalies were in the western U.S. Casper, WY topped the global list.
Table 1. Top five U.S. cities with the highest temperature anomalies from December 1, 2025, to February 28, 2026.
City
Seasonal temperature difference from normal (°F)
Days at CSI level 2 or higher
1. Casper, WY
13.0°
5 days
2. Grand Junction, CO
10.1°
34 days
3. Bozeman, MT
9.7°
18 days
4. Denver, CO
9.3°
17 days
5. Cheyenne, WY
8.9°
7 days
Human-caused climate change made this exceptionally warm winter in the western U.S. more likely.
-
The average person living in Hawaii, Arizona, California, Nevada, or New Mexico experienced more than a month’s worth of unusually warm temperatures made at least twice as likely due to climate change.
-
The average person living in 54 U.S. cities, mostly in the Western U.S., experienced at least two weeks’ worth of temperatures made at least two times more likely by climate change.
-
Outside the contiguous U.S., San Juan, Puerto Rico and Honolulu top the list with the average resident experiencing 82 and 59 such days.
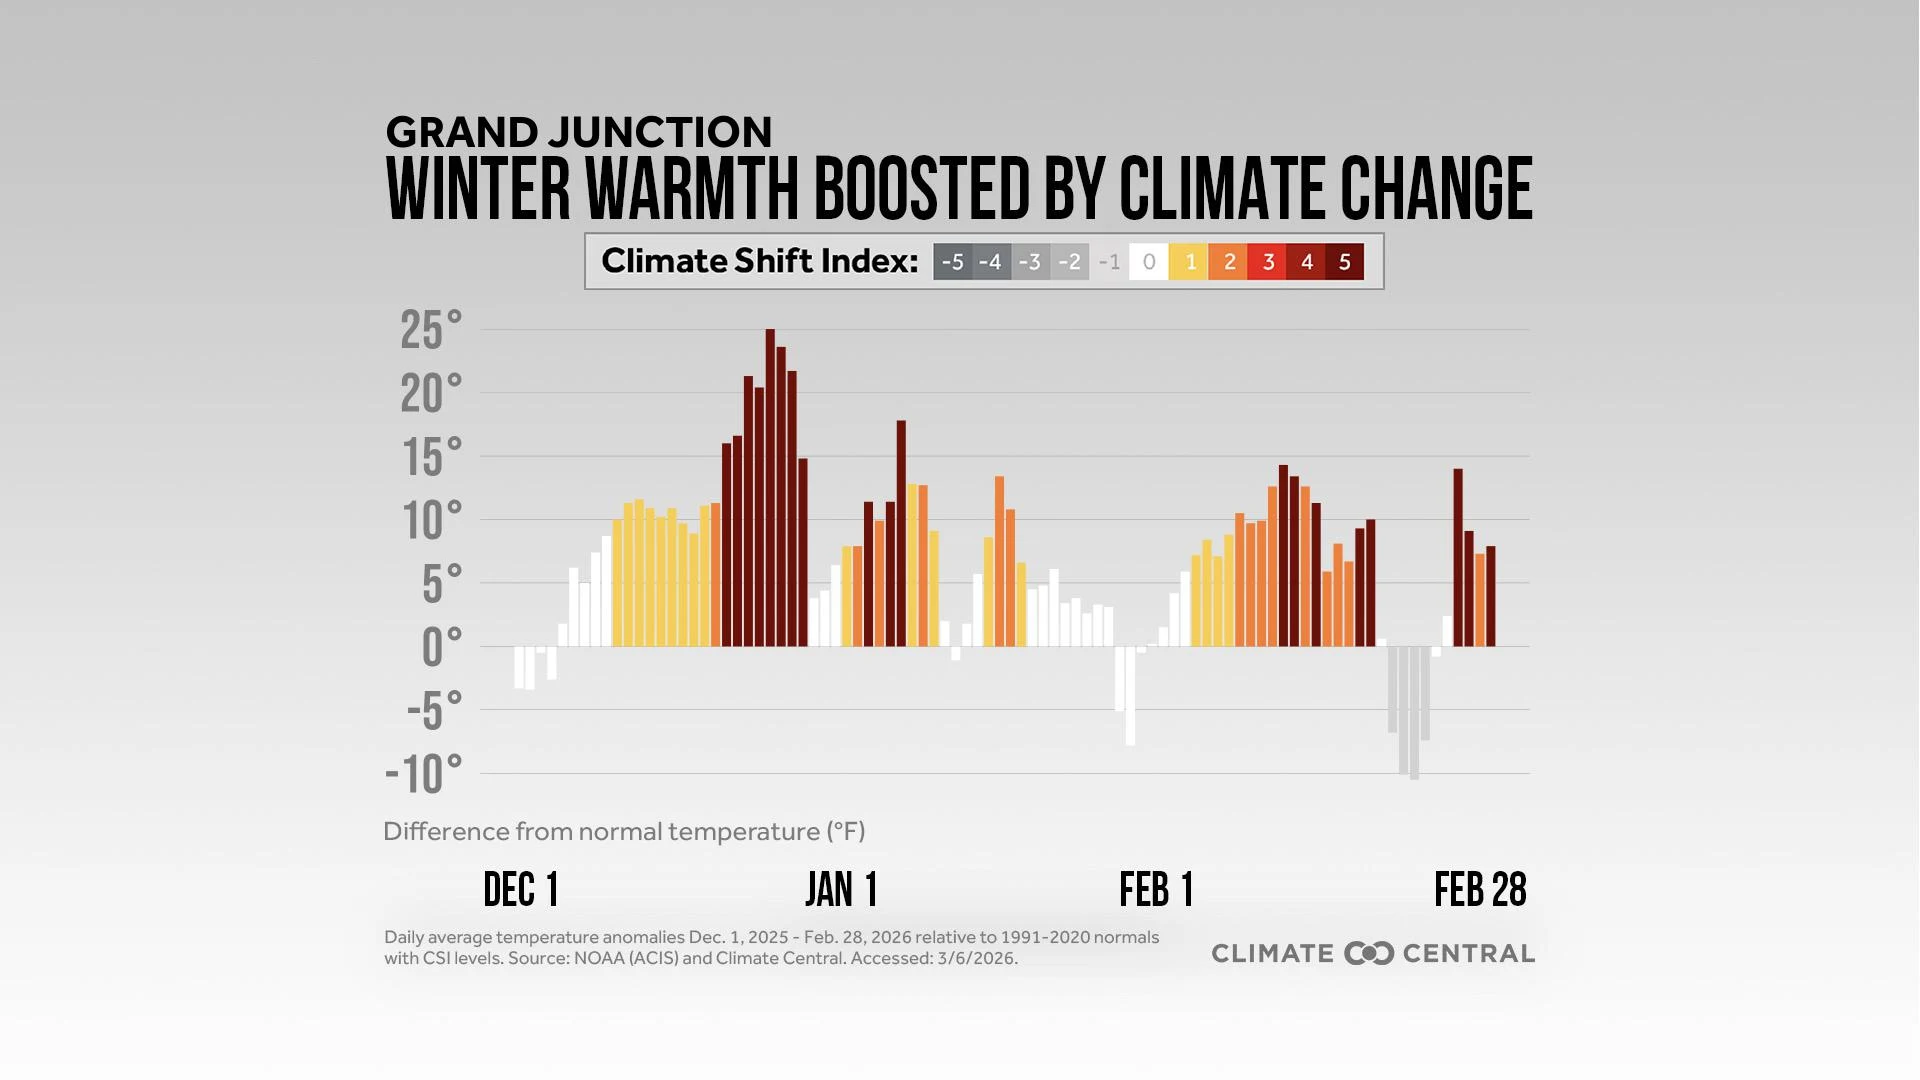 Click the downloadable graphic: Winter 2025-2026 Daily Temperatures and CSI
Table 2. Top five U.S. cities with the most total days at CSI 2 or higher from December 1, 2025, to February 28, 2026.
City
Days at CSI level 2 or higher
Seasonal temperature difference from normal (°F)
1. San Juan, Puerto Rico
82 days
1.1°
2. Honolulu, HI
59 days
1°
3. Prescott, AZ
51 days
5°
4. Santa Maria, CA
49 days
3.8°
5. Phoenix, AZ
48 days
4.9°
This unusual western winter warmth can have year-round consequences. For example, the current record-low snowpack in Oregon, Colorado, and Utah threatens western water supplies. Warmer, low-snow winters mean smaller snow reserves that melt earlier yet need to stretch longer to meet the region’s water demands. Snow drought can also lead to drier forests and grasslands that can fuel more intense wildfires.
Climate change made the cold winter in the eastern U.S. less likely
Much of the eastern U.S. experienced below-average temperatures this past winter. Although no states had a record-cold winter, December-February temperatures in 21 eastern states were at least 1°F below normal.
Although seasonal average temperatures were not exceptionally colder than normal, several disruptive and dangerous extreme cold events affected the eastern U.S. this winter.
Mid-December 2025 Midwestern cold period: less likely in a warming world
-
During a mid-December cold period in the Midwest, 62 U.S. cities (for example: Detroit) experienced temperatures at least twice as unlikely to occur (CSI level -2 or below) because of climate change.
January 2026 cold snap in the east: less likely in a warming world
-
According to the CSI, the late January 2026 cold snap that gripped much of the eastern half of the country was made less likely to occur in many areas because of human-caused climate change.
-
This effect was most widely felt on January 25 when temperatures across 34 eastern U.S. cities (for example: Syracuse, NY) averaged 22.6°F below normal and were at least two times less likely to occur due to heat-trapping pollution.
February 2026 blizzard: no climate change influence on temperatures
-
A historic blizzard brought heavy snow, high winds, and below-normal temperatures to the Northeast in late February. CSI data indicates that human-caused climate change had no detectable influence on temperatures in the Northeast during the core of this event.
In a world warmed by heat-trapping pollution, these types of cold snaps still happen. But CSI data shows that climate change is making them less likely to occur now and in the future.
LOCAL STORY ANGLESIs climate change influencing daily temperatures in your local area?
Climate Central’s Climate Shift Index (CSI) system provides tools, data, custom maps, and local alerts to answer this question in real-time. Here are three ways to use the CSI:
-
Use the CSI map tool to see which parts of the world are experiencing high CSI levels today, tomorrow, and any day in the recent past.
-
Access the CSI in KML format to bring this high-resolution data into your on-air broadcasts.
-
Sign up for alerts to receive custom emails when strong CSI levels are detected in your local area.
CONTACT EXPERTS
To request an interview with a Climate Central expert about this analysis, please contact Abbie Veitch, aveitch@climatecentral.org.
METHODOLOGY
All Climate Shift Index (CSI) levels reported in this brief are based on daily average temperatures and ECMWF ERA5 data from December 1, 2025, to February 28, 2026. See the frequently asked questions for details on computing the Climate Shift Index, including a summary of the multi-model approach described in Gilford et al. (2022).
For the set of local graphics included in this release, daily average temperature anomalies (relative to 1991-2020 normals) from December 1, 2025, to February 28, 2026 were obtained from the Applied Climate Information System (ACIS), which is developed, maintained, and operated by NOAA’s Regional Climate Centers. Three locations were missing data for at least half of the days analyzed and do not have local graphics: Chico, CA; Palm Springs, CA; and Bend, OR.
Values shown in maps and tables across this website have been rounded for clarity. For exact values, please download the full dataset.
A detailed methodology can be found in the full report.