

According to Eurostat figures published on March 26th, of these one million deaths, 376 434 were due to treatable diseases and conditions that could have been avoided through high-quality healthcare, while 655 321 were due to preventable diseases that could have been avoided through effective public health interventions.
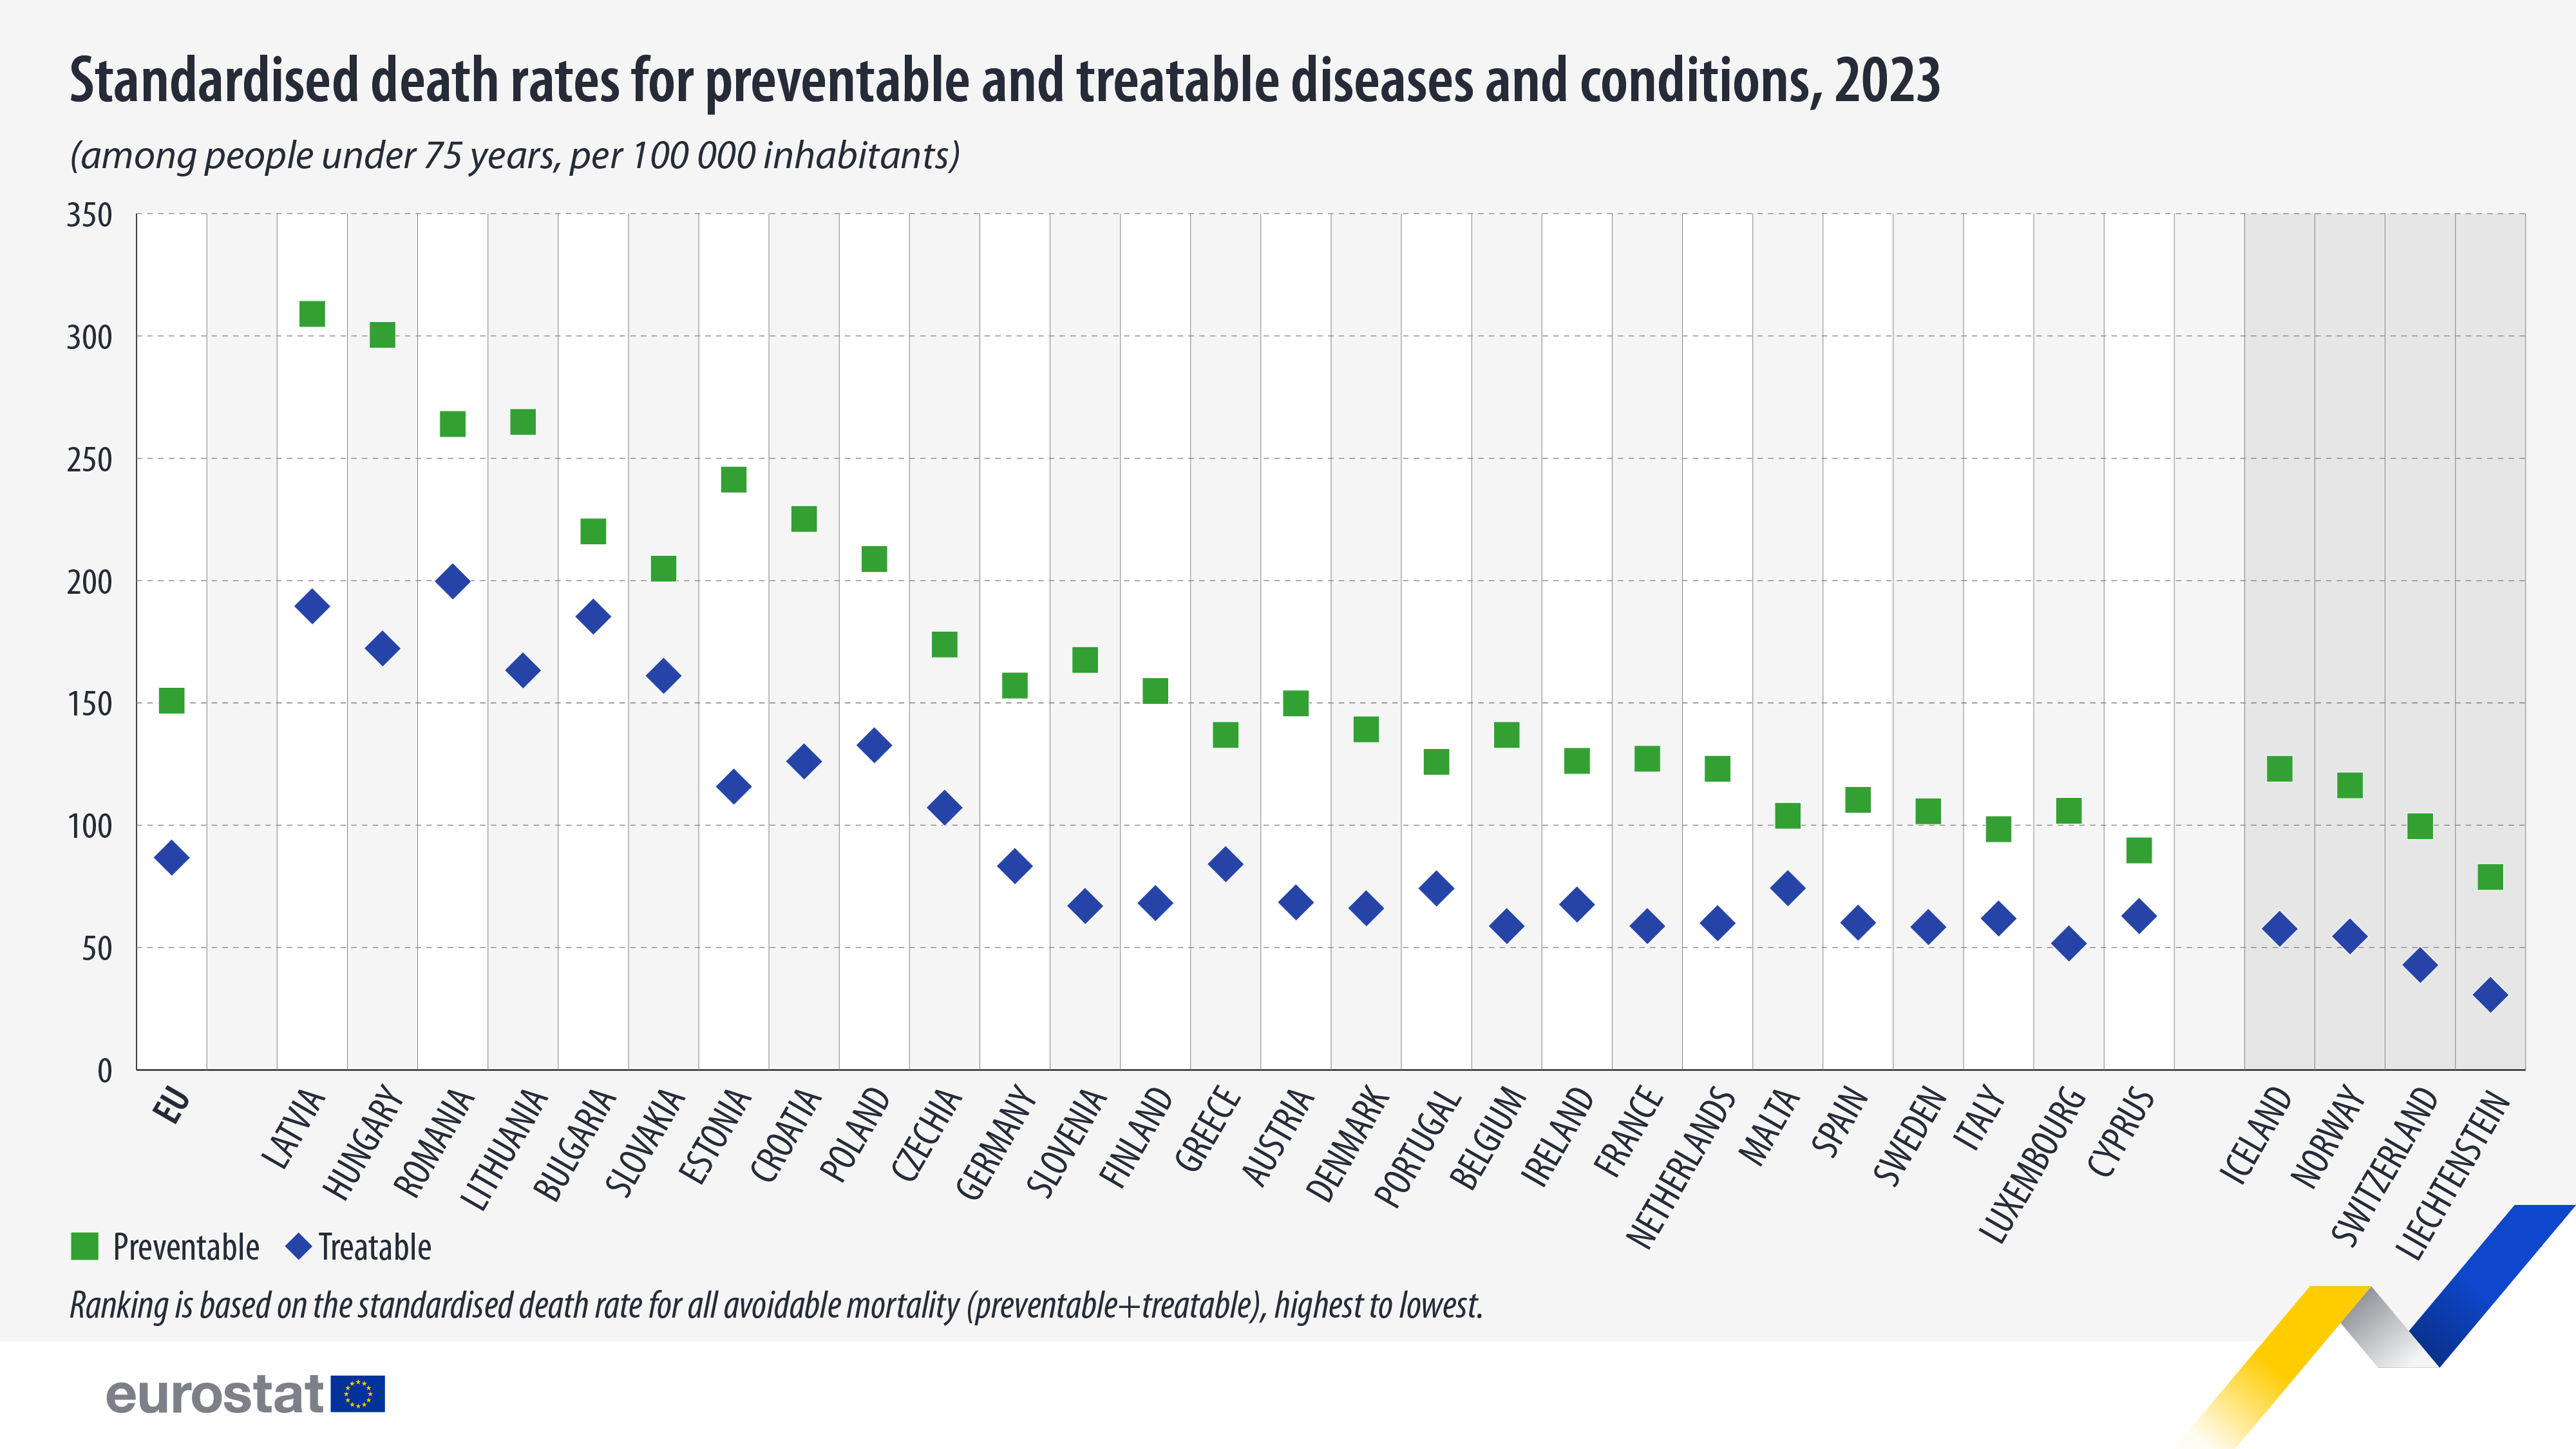
The standardised death rate from all avoidable conditions was 237.7 deaths per 100 000 inhabitants, 86.8 from treatable and 150.9 from preventable conditions.
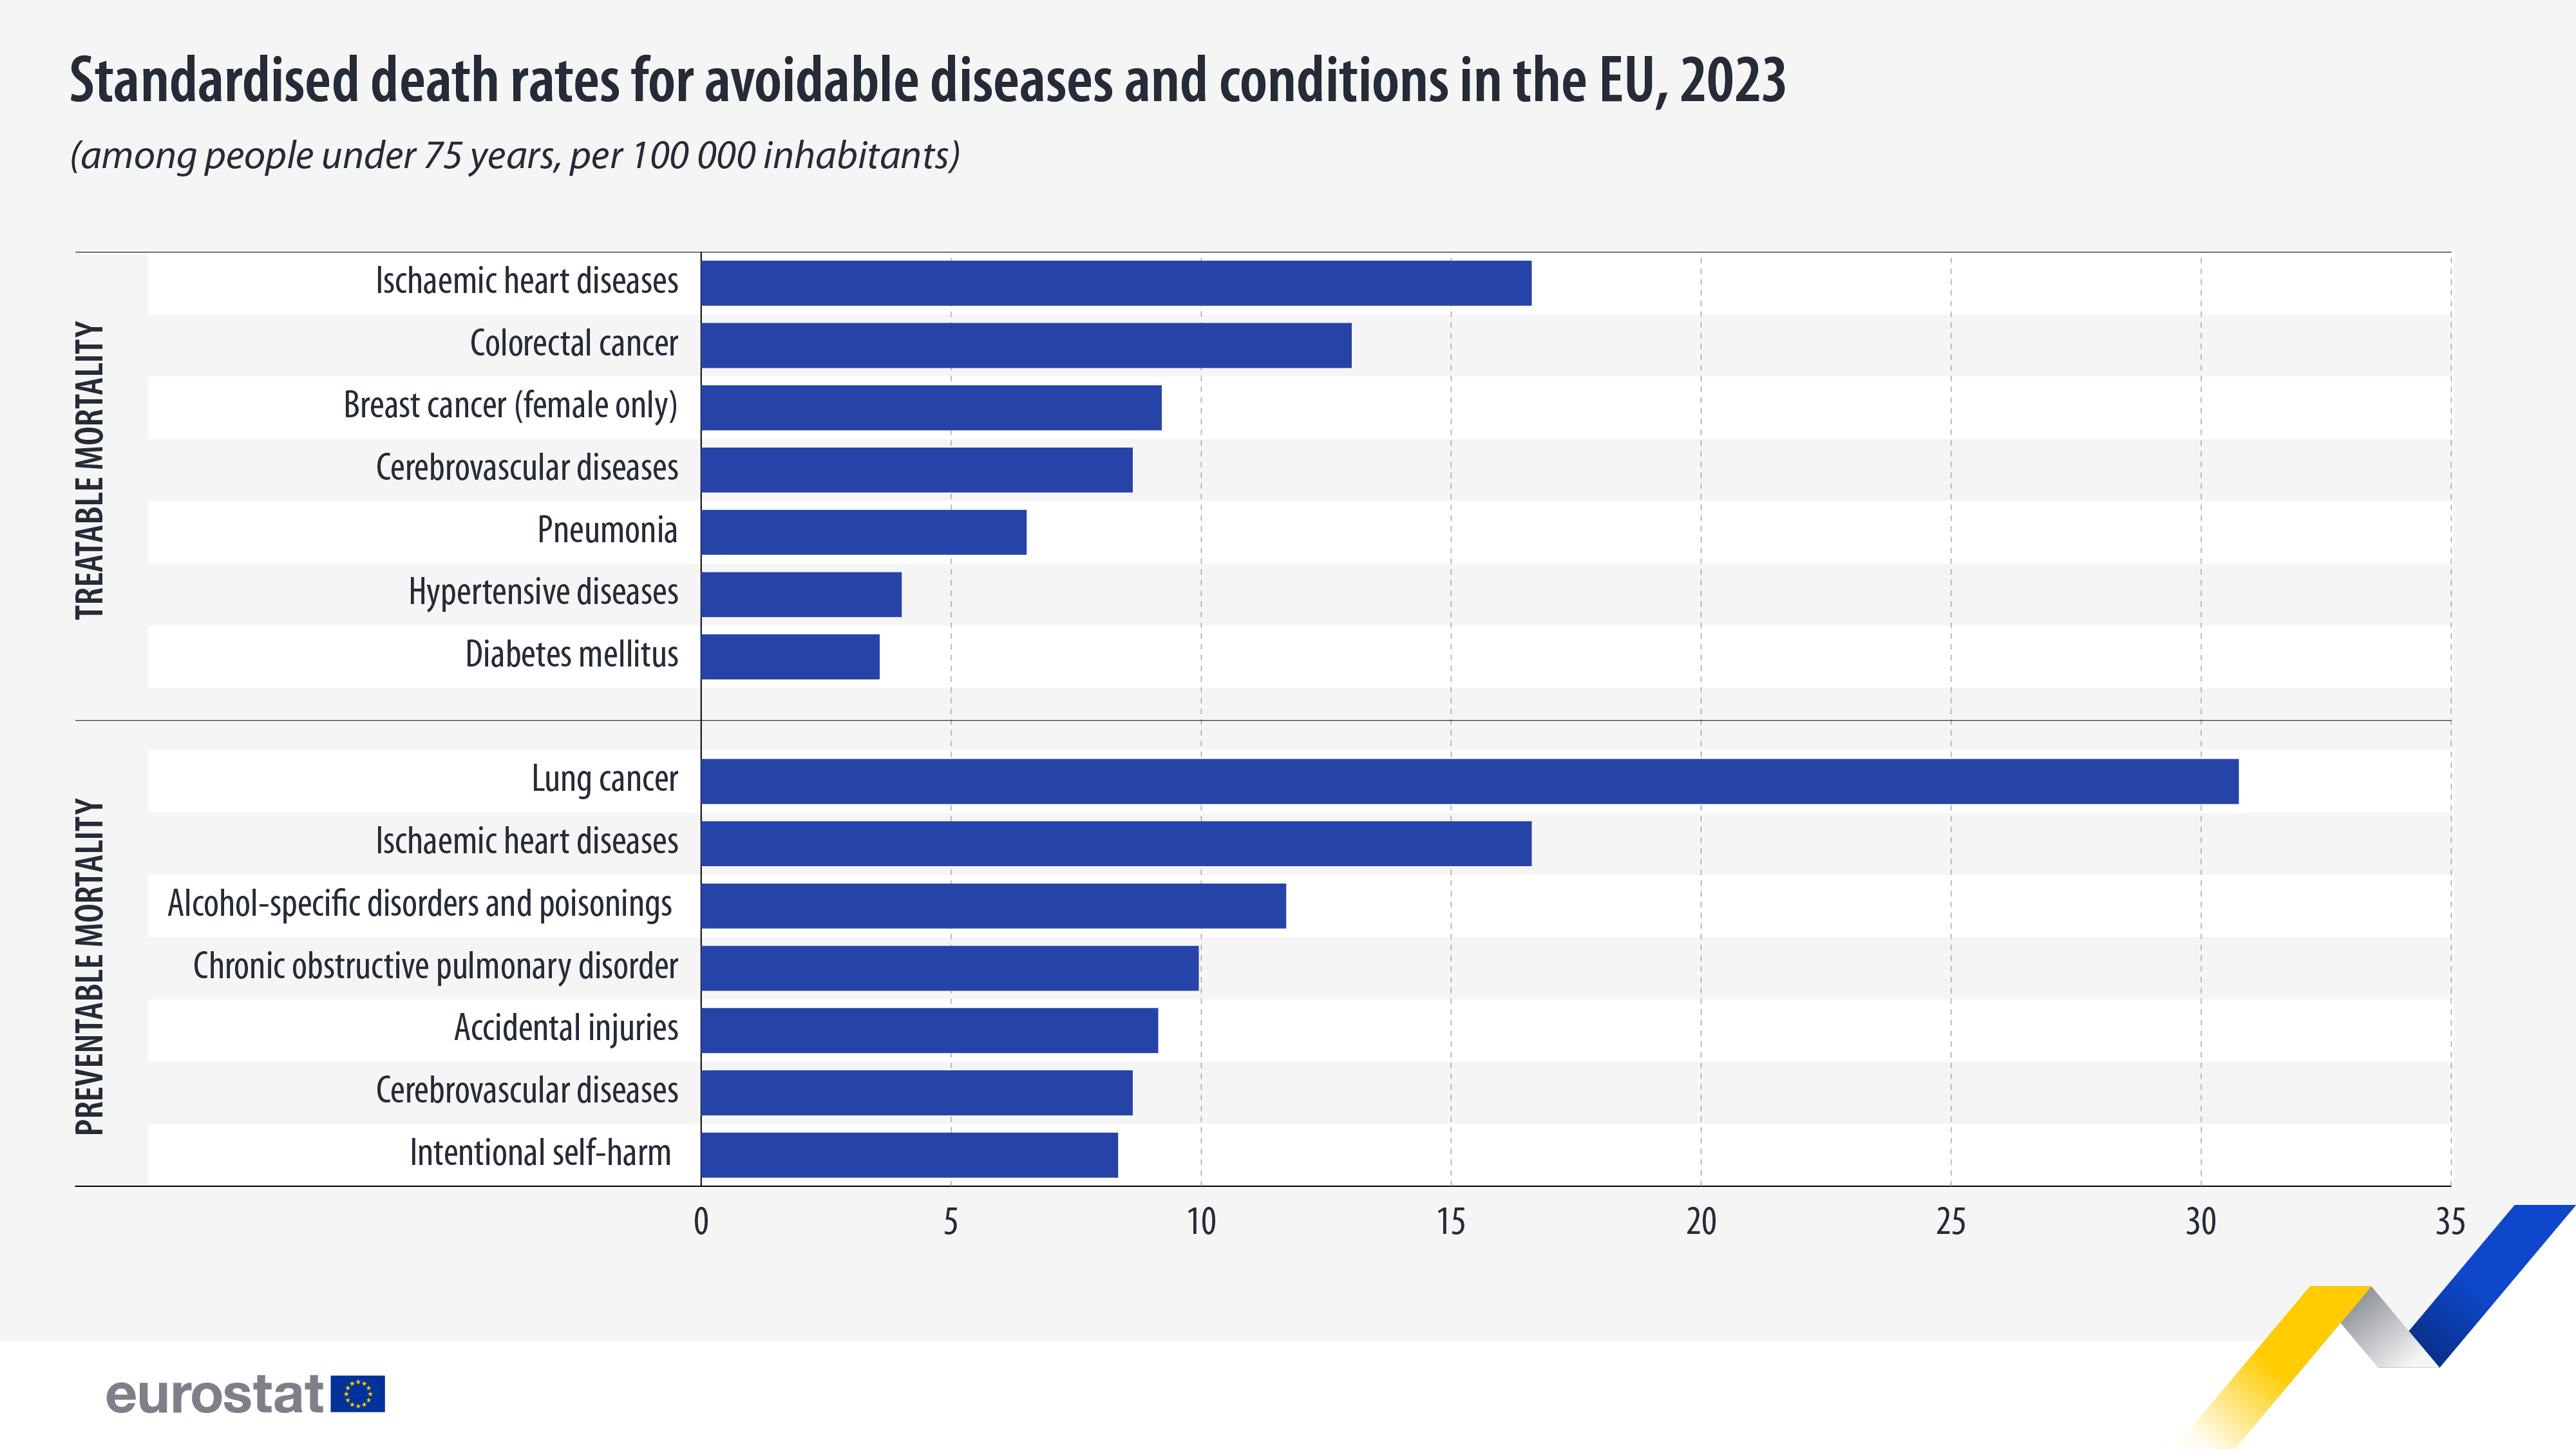
For preventable diseases, the most common causes of death were lung cancer with 135 584 (30.8 per 100 000 inhabitants), ischaemic heart disease with 72 845 deaths (16.6 per 100 000 inhabitants), and alcohol-specific disorders and poisonings, with 50 593 deaths (11.7 per 100 000 inhabitants).
Latvia recorded the highest rate with 498.5 avoidable deaths per 100 000 inhabitants, including 189.5 from treatable and 309.0 from preventable conditions and diseases. Hungary registered 472.7 avoidable deaths (172.3 treatable and 300.4 preventable), while Romania had 463.7 avoidable deaths (199.7 treatable and 264.0 preventable).
As well as being in first place on preventable deaths, Latvia was in second place on treatable deaths, behind Romania.
The lowest rates of avoidable deaths were registered in Cyprus with 152.6 per 100 000 inhabitants (62.9 treatable and 89.7 preventable), Luxembourg with 157.6 (51.7 treatable and 105.9 preventable) and Italy with 160.3 (61.9 treatable and 98.4 preventable).
Select text and press Ctrl+Enter to send a suggested correction to the editor
Select text and press Report a mistake to send a suggested correction to the editor
Tell us about a mistake