
 After The Recent Share Price Slump?")
- Wondering whether CVS Health at around US$70 still offers value, or if the easy money has already been made? This article walks through the key numbers so you can judge for yourself.
- The stock is around US$70.08 after a 1.7% decline over the past week and double digit declines of 12.3% for the past month and 12.5% year to date, even though the 1 year return sits at 7.4% and the 3 and 5 year returns are 3.4% and 10.0% respectively.
- Recent headlines around CVS Health have focused on its role as a major healthcare and pharmacy player in the US, including coverage of its retail footprint and broader healthcare services. This kind of attention can influence how investors weigh both the company’s growth potential and its risks, which often shows up in shorter term price moves.
- Right now CVS Health scores a 3 out of 6 on our valuation checks. The rest of this article will walk through traditional methods like P/E, cash flows and assets, before finishing with a more holistic way to think about what that score really means for you.
Approach 1: CVS Health Discounted Cash Flow (DCF) Analysis
A Discounted Cash Flow model projects a company’s future cash flows and then discounts them back to today’s dollars, aiming to estimate what the business might reasonably be worth right now.
For CVS Health, the latest twelve month Free Cash Flow is about $7.6b. Using a 2 Stage Free Cash Flow to Equity model, analysts provide explicit forecasts out to 2030, with Simply Wall St extrapolating beyond the initial analyst window. Under these assumptions, projected Free Cash Flow reaches $14.0b in 2030, with the intervening years ranging between roughly $7.1b and $20.3b in the estimates provided.
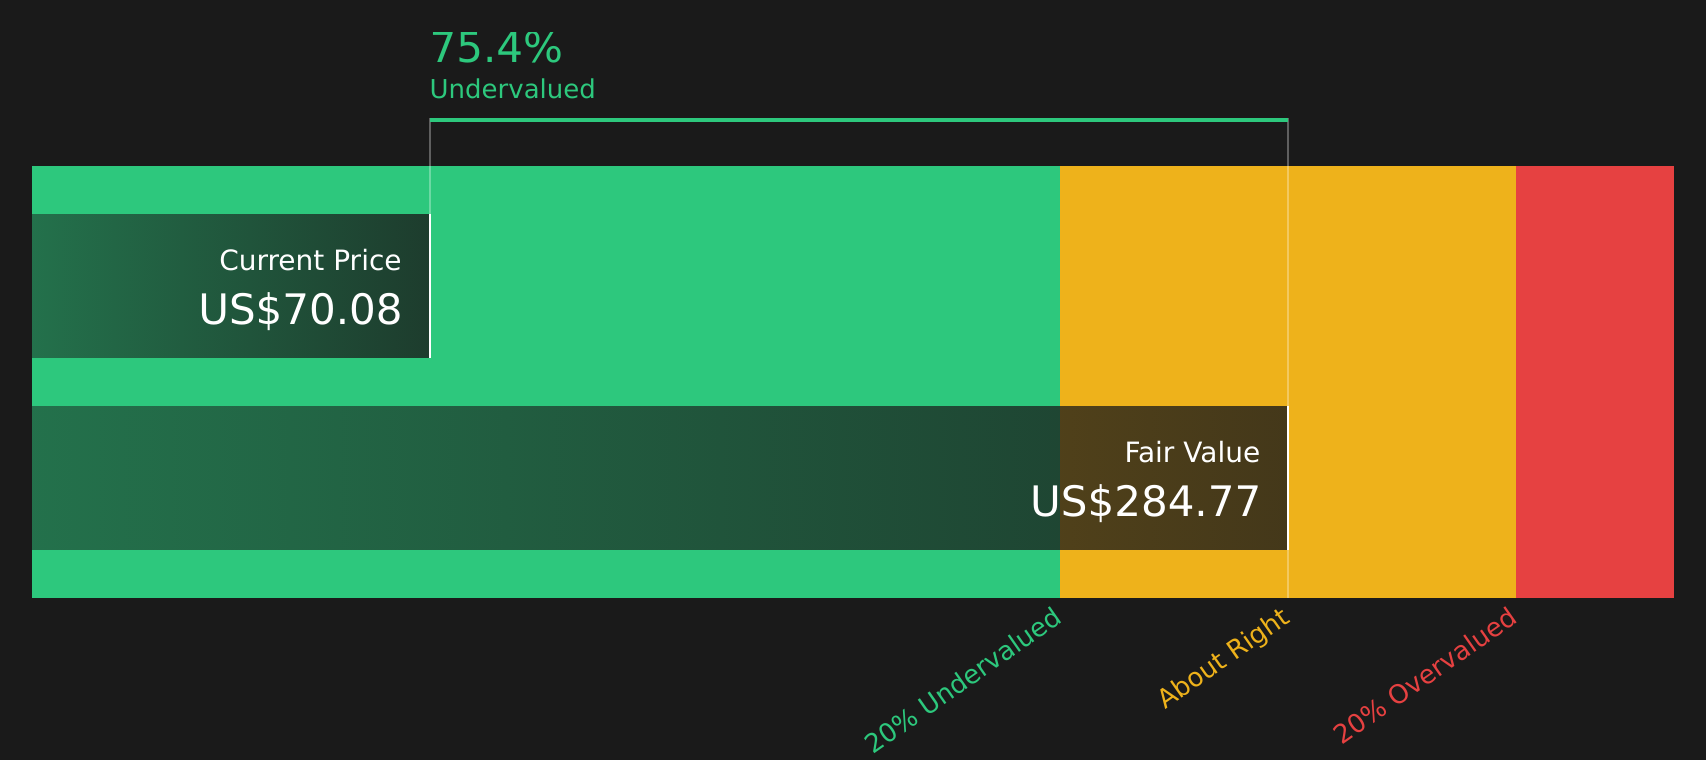
When all those projected cash flows are discounted back to today, the model arrives at an estimated intrinsic value of about $284.77 per share. Compared with a recent share price of roughly $70, this suggests the stock trades at a discount of about 75.4%, indicating a wide gap between the cash flow based valuation and the current market price.
Result: UNDERVALUED
Our Discounted Cash Flow (DCF) analysis suggests CVS Health is undervalued by 75.4%. Track this in your watchlist or portfolio, or discover 62 more high quality undervalued stocks.
 CVS Discounted Cash Flow as at Mar 2026
Approach 2: CVS Health Price vs Earnings
For a profitable company like CVS Health, the P/E ratio is a useful way to see how much you are paying for each dollar of current earnings. Investors usually accept a higher P/E if they expect stronger growth or see lower risk, while slower growth or higher risk tends to justify a lower, more conservative multiple.
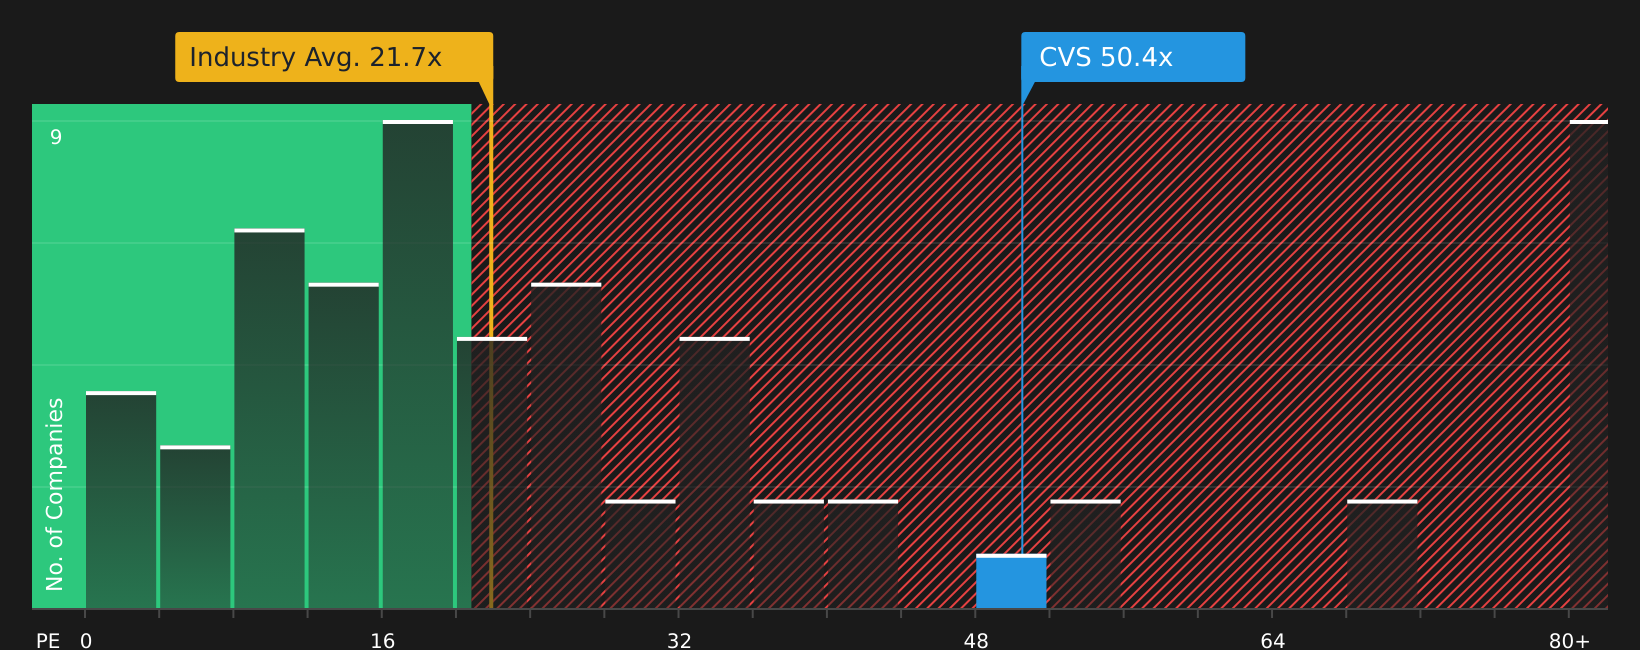
CVS Health currently trades on a P/E of 50.4x. That sits above both the Healthcare industry average of 21.7x and the peer group average of 18.1x, which signals that the market is assigning a higher earnings multiple to CVS Health than to many comparable names. Simply Wall St’s Fair Ratio for CVS Health is 41.7x, which reflects its proprietary view of what a “normal” P/E might be given factors such as earnings growth, profit margins, industry, market cap and risk profile.
This Fair Ratio goes a step beyond simple peer or industry comparisons because it attempts to tailor the P/E expectation to the company’s own fundamentals and risk factors, rather than assuming one size fits all. With the current P/E of 50.4x sitting above the Fair Ratio of 41.7x, CVS Health appears to be trading at a richer multiple than that model suggests.
Result: OVERVALUED
 NYSE:CVS P/E Ratio as at Mar 2026
P/E ratios tell one story, but what if the real opportunity lies elsewhere? Start investing in legacies, not executives. Discover our 20 top founder-led companies.
Upgrade Your Decision Making: Choose your CVS Health Narrative
Earlier the article mentioned that there is an even better way to understand valuation. Narratives are introduced here as a simple way for you to write the story behind your numbers by linking your own assumptions about CVS Health’s future revenue, earnings and margins to a financial forecast and a fair value estimate that can be compared directly with today’s share price.
On Simply Wall St’s Community page, Narratives are available as an accessible tool used by millions of investors. They allow you to set inputs like long term revenue growth, profit margins and a future P/E, have that turned into a full set of projected financials and a fair value, and then see at a glance whether your view suggests CVS is priced above or below what you consider reasonable.
Narratives are updated automatically when new data arrives, for example earnings, guidance or news releases. This means your fair value view can stay aligned with fresh information instead of relying on a one off model that goes stale.
For CVS Health, one investor on the platform currently has a Narrative with a fair value of about US$62 per share based on 7.0% revenue growth and a future P/E of 12.0x, while an analyst consensus Narrative sits higher at roughly US$96.50 using 3.67% revenue growth and a future P/E of 15.10x. This shows how two informed but different stories can lead to very different conclusions when each is compared to a recent price near US$70.
For CVS Health, here are previews of two leading CVS Health Narratives for you to review:
Fair value: US$104.01
Implied undervaluation vs US$70.08: about 32.7%
Revenue growth used in the model: 18.02%
- The author views CVS as a healthcare platform in transition, with its Health Care Benefits segment and government contracts playing a central role in the story.
- Cost pressures, restructuring charges and integration of deals such as Signify Health and Oak Street Health are acknowledged as risks that need to be managed.
- This narrative argues that the current price does not fully reflect the company’s cash flow potential or the benefits of an integrated care model if execution improves over time.
Fair value: US$62.09
Implied overvaluation vs US$70.08: about 12.9%
Revenue growth used in the model: 7.0%
- On the positive side, CVS’ mix of insurance, PBM and provider services is seen as offering potential revenue and cost synergies if it can manage patients more holistically.
- The bear points focus on risks such as ongoing healthcare reform debates, pressure on the retail store network as spending shifts online and weaker profit growth prospects compared with some managed care peers.
- Taken together, this view suggests that the market might be assigning too rich a price if these operational and policy risks weigh on future earnings more than the market currently assumes.
If you want to see how your own assumptions compare with these two viewpoints, you can use Narratives to build and track your personal fair value range for CVS in just a few minutes using the same framework other investors are applying.
Do you think there’s more to the story for CVS Health? Head over to our Community to see what others are saying!
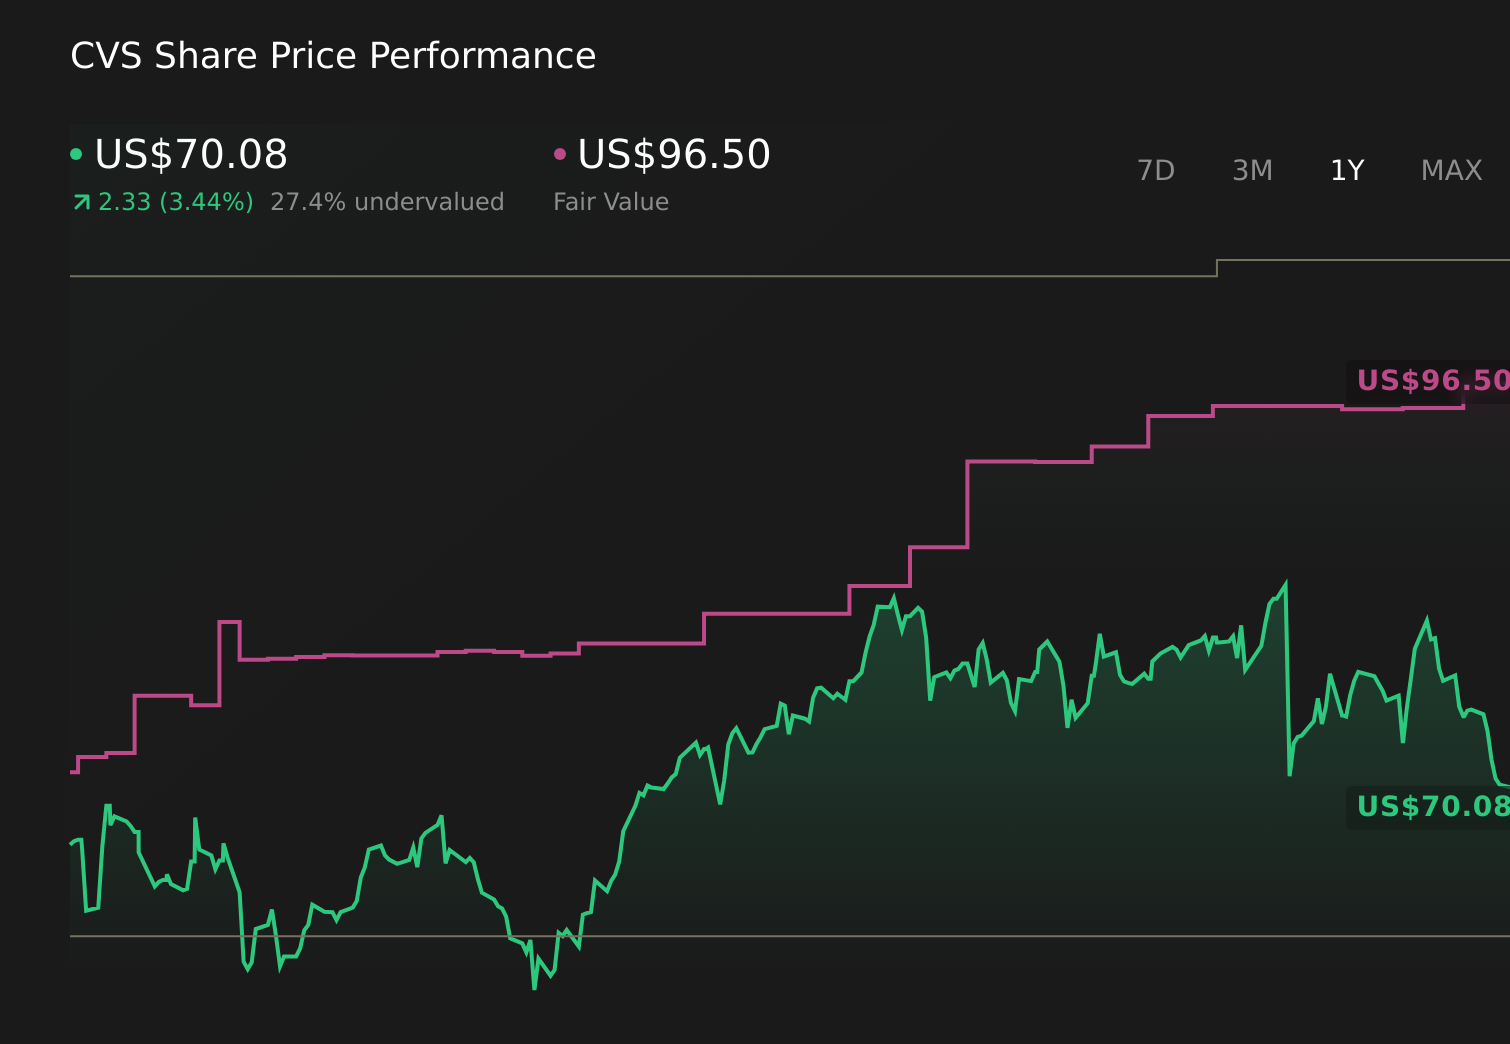 NYSE:CVS 1-Year Stock Price Chart
This article by Simply Wall St is general in nature. We provide commentary based on historical data
and analyst forecasts only using an unbiased methodology and our articles are not intended to be financial advice. It does not constitute a recommendation to buy or sell any stock, and does not take account of your objectives, or your
financial situation. We aim to bring you long-term focused analysis driven by fundamental data.
Note that our analysis may not factor in the latest price-sensitive company announcements or qualitative material.
Simply Wall St has no position in any stocks mentioned.
Our new AI Stock Screener scans the market every day to uncover opportunities.
• Dividend Powerhouses (3%+ Yield)
• Undervalued Small Caps with Insider Buying
• High growth Tech and AI Companies
Or build your own from over 50 metrics.
Have feedback on this article? Concerned about the content? Get in touch with us directly. Alternatively, email editorial-team@simplywallst.com