

Written on 03/04/2026
As we approach the return of club football for the final stretch of the season, one thing that has been on my mind is how Liverpool have performed almost like two different teams in the Champions League compared to their bread-and-butter fixtures in the Premier League.
In crude terms, out of the 10 games played in Europe so far, the Reds have won seven and lost three (the third of the latter, away at Galatasaray in the last-16 stage, being of no consequence as they overturned the deficit and won the tie). This amounts to a 70% win rate in the continental competition, compared to a rather disappointing figure of just over 45% in the Premier League.
Now, there are plenty of tactical and stylistic caveats behind this, as England’s top flight has taken a different route this season (more physical and increasingly reliant on dead-ball ‘patterns’). At the same time, the Champions League continues to favour sides with pace and technical quality above all else.
Let’s park those caveats for now and take a closer look at the overall and underlying numbers of Arne Slot’s team, comparing their output in the Premier League with that in the Champions League. The aim is to draw out meaningful observations from the data and visuals by the end of this article.
PS: Liverpool have played 31 games in the league and 10 in the Champions League, so there is a sufficient sample size for a data-driven comparison.
First off, the basic offensive and defensive numbers are compared in the two tables below.
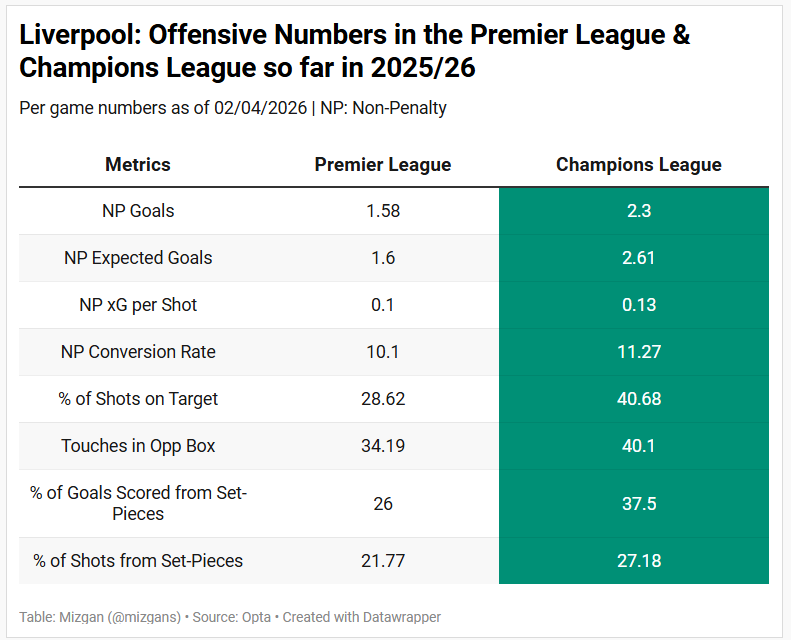
In every key offensive metric, Liverpool are performing significantly better in the Champions League, despite having already faced some tough teams in that competition (including games against Real Madrid and Atlético Madrid at home, as well as difficult away trips to Marseille, Galatasaray and Inter Milan, for example).
The proportion of ‘tough’ games in the league is likely lower, yet the Reds have somehow struggled to put teams away, even those in the bottom half of the table. The failure to win a single home game against each of the promoted sides offers a small glimpse into the horror show domestically.
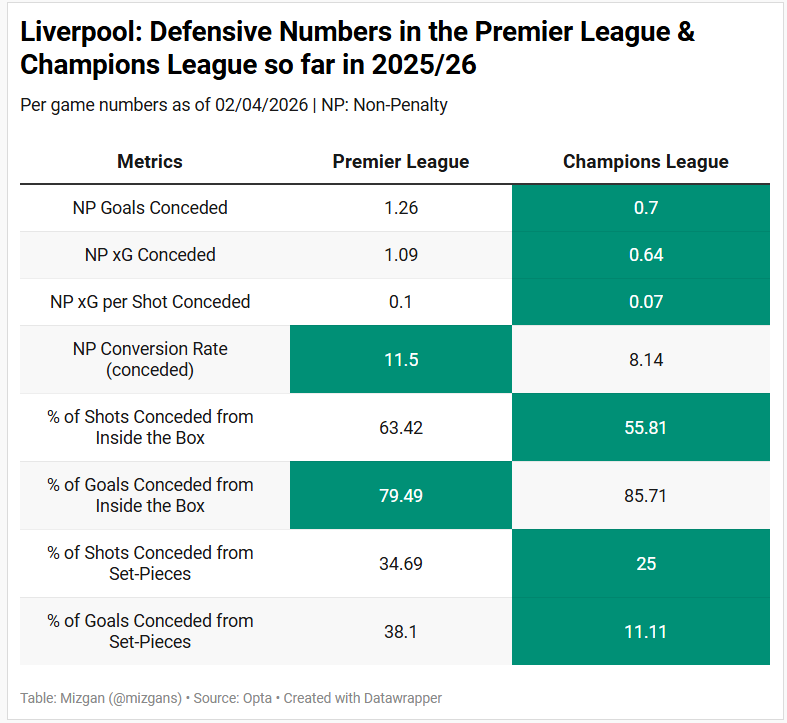
The first three metrics show how solid Slot’s men have been defensively in Europe. They have been just a tad unlucky in the league, with opposition teams recording a conversion rate of over 11% against them.
That, however, could be down to them conceding a far higher proportion of shots from inside the box domestically. And the less said about their defensive set-piece numbers in the league, the better (even though there have been improvements since the turn of the year and the change of set-piece analyst).
One thing that has come out after going through those data tables: Liverpool are just a different team in the Champions League.
The above was simply a look at the crude numbers and a basic comparison. Let’s go a bit deeper into the performance metrics and try to draw more definitive juxtapositions as to how the Reds have been far better on the continent.
Let’s start with the duels won and lost heatmaps and go from there.
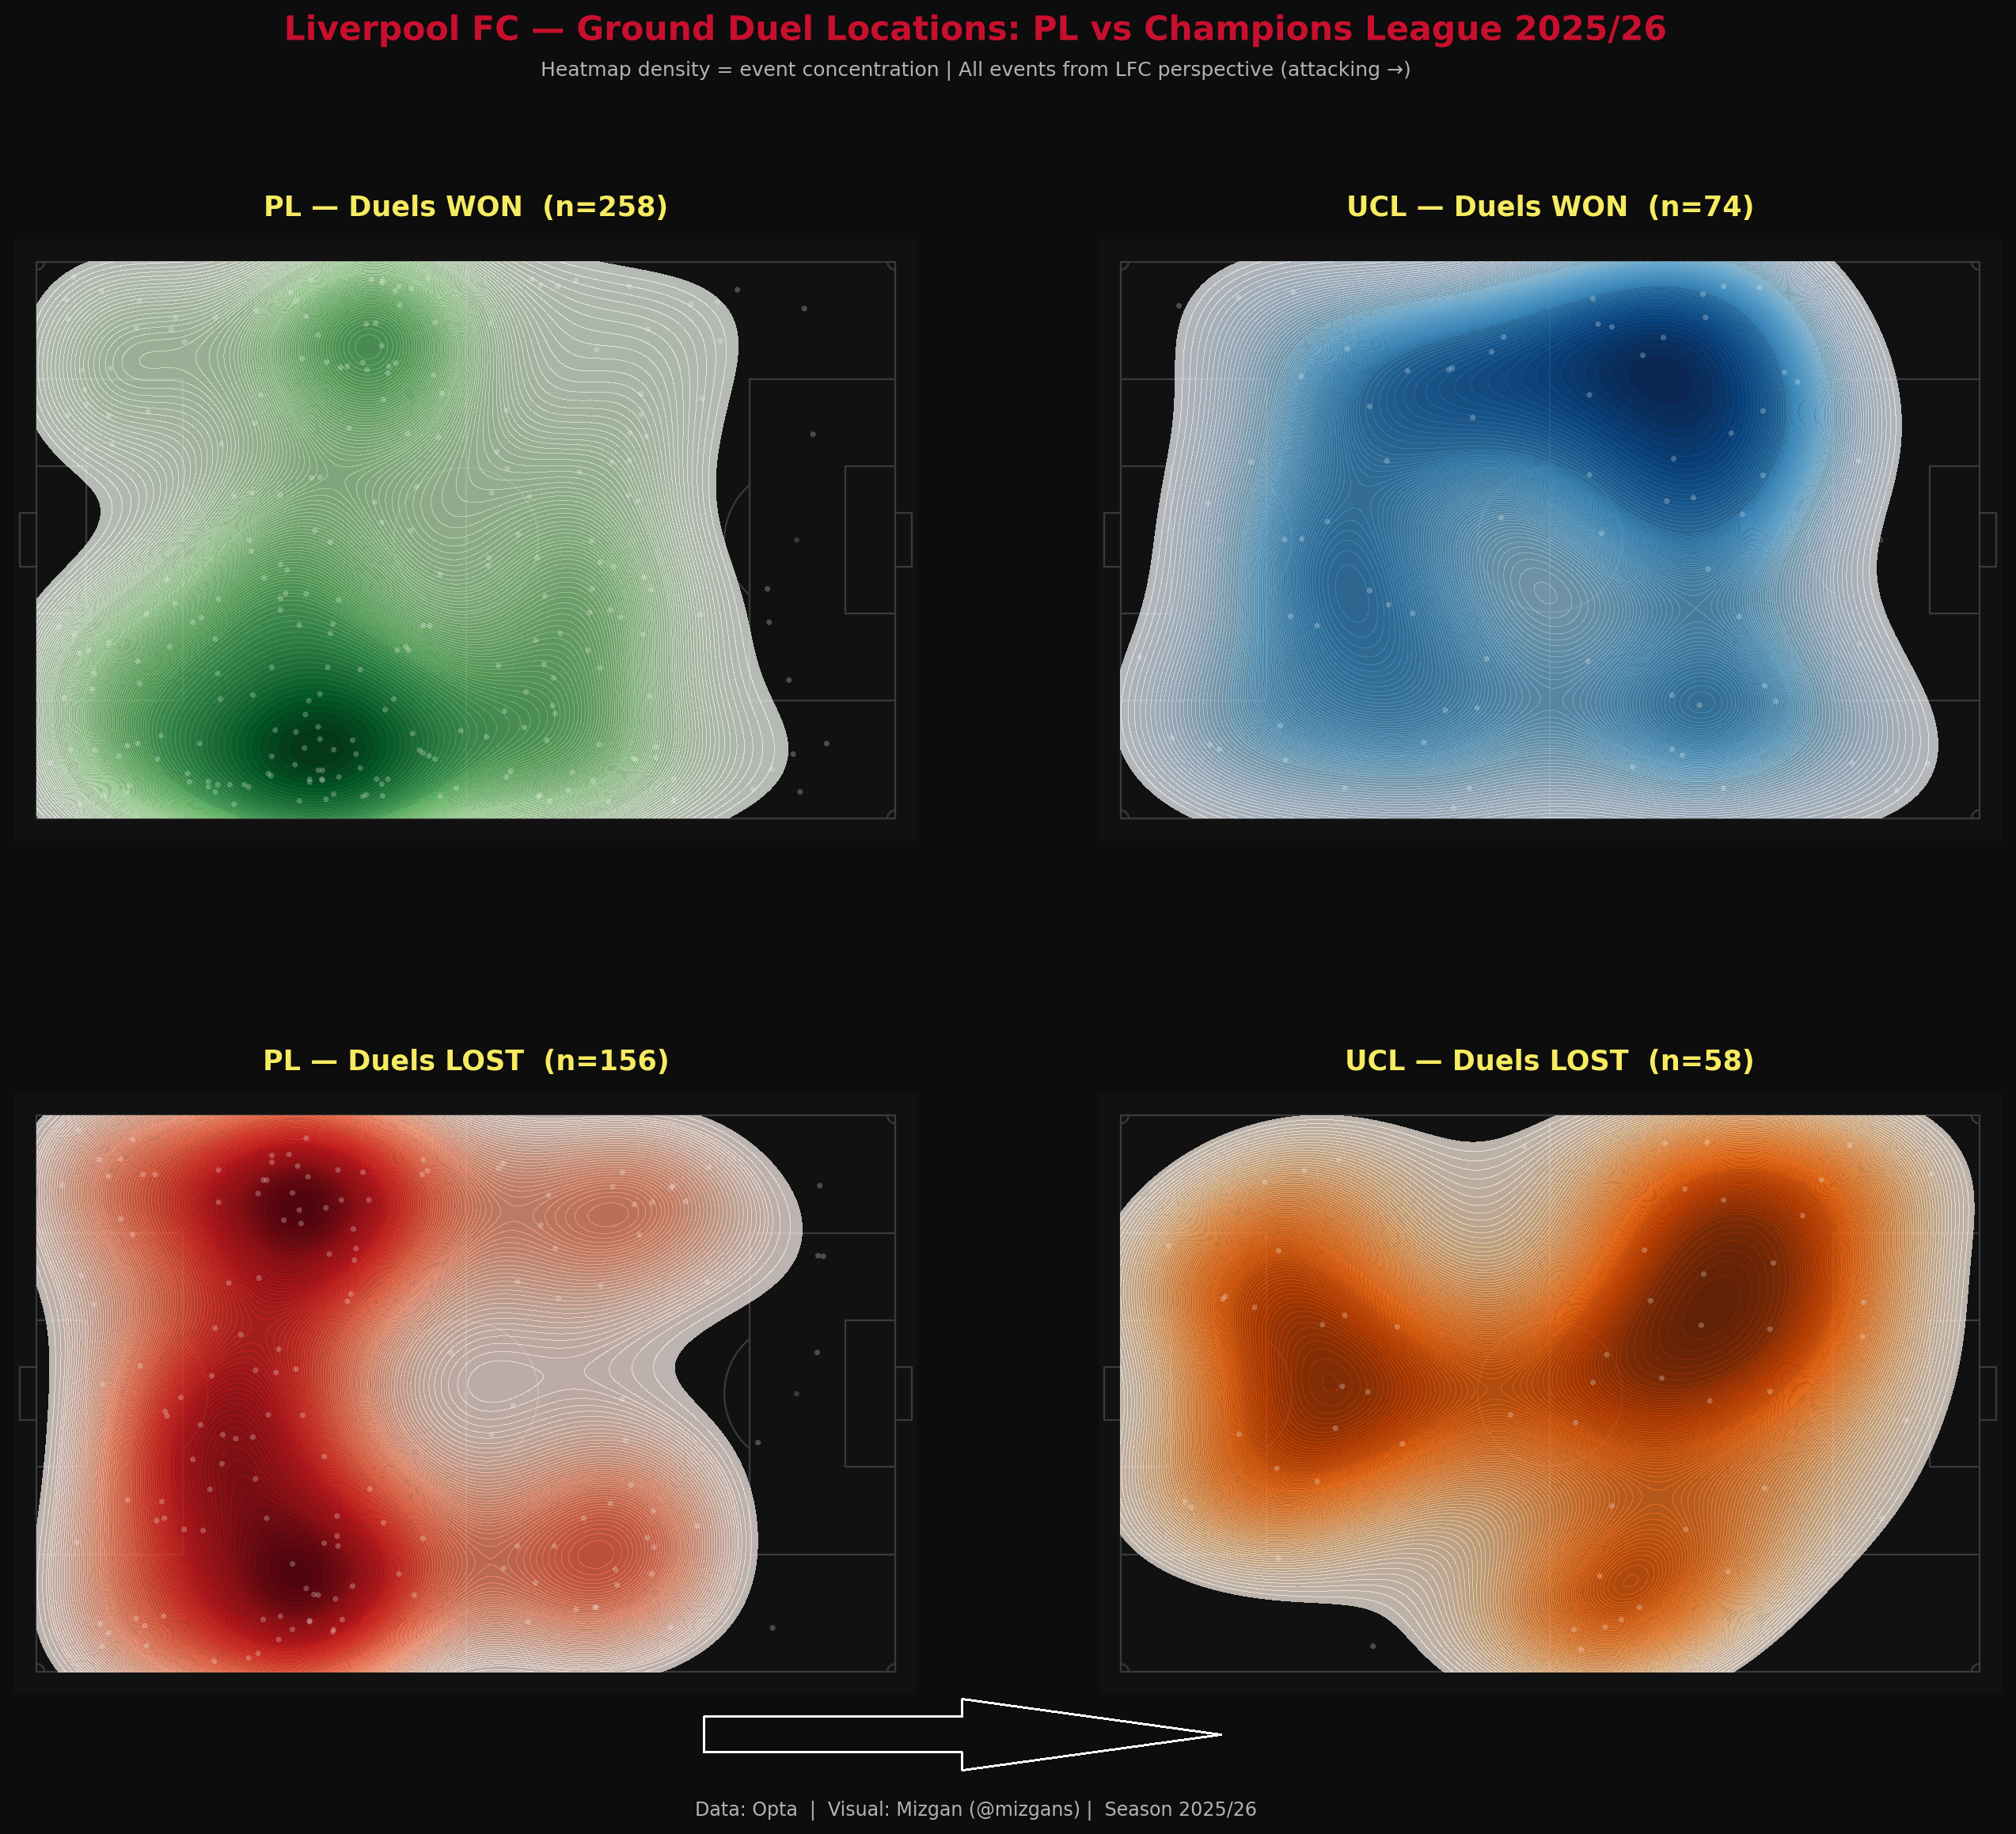
Looking at the Champions League (UCL) section for both won and lost duels, a higher proportion of these occur in the opposition half and higher up the pitch. This suggests that Liverpool are engaging in duels through pressing and operating higher up the pitch in Europe, compared to the league, where they are losing a larger proportion of duels in their own final third.
While this helps explain their domestic struggles (losing a large proportion of duels close to their own goal is far from ideal), it also highlights the stylistic difference between games in England and those in Europe.
Next up, counter-pressing numbers and zones.
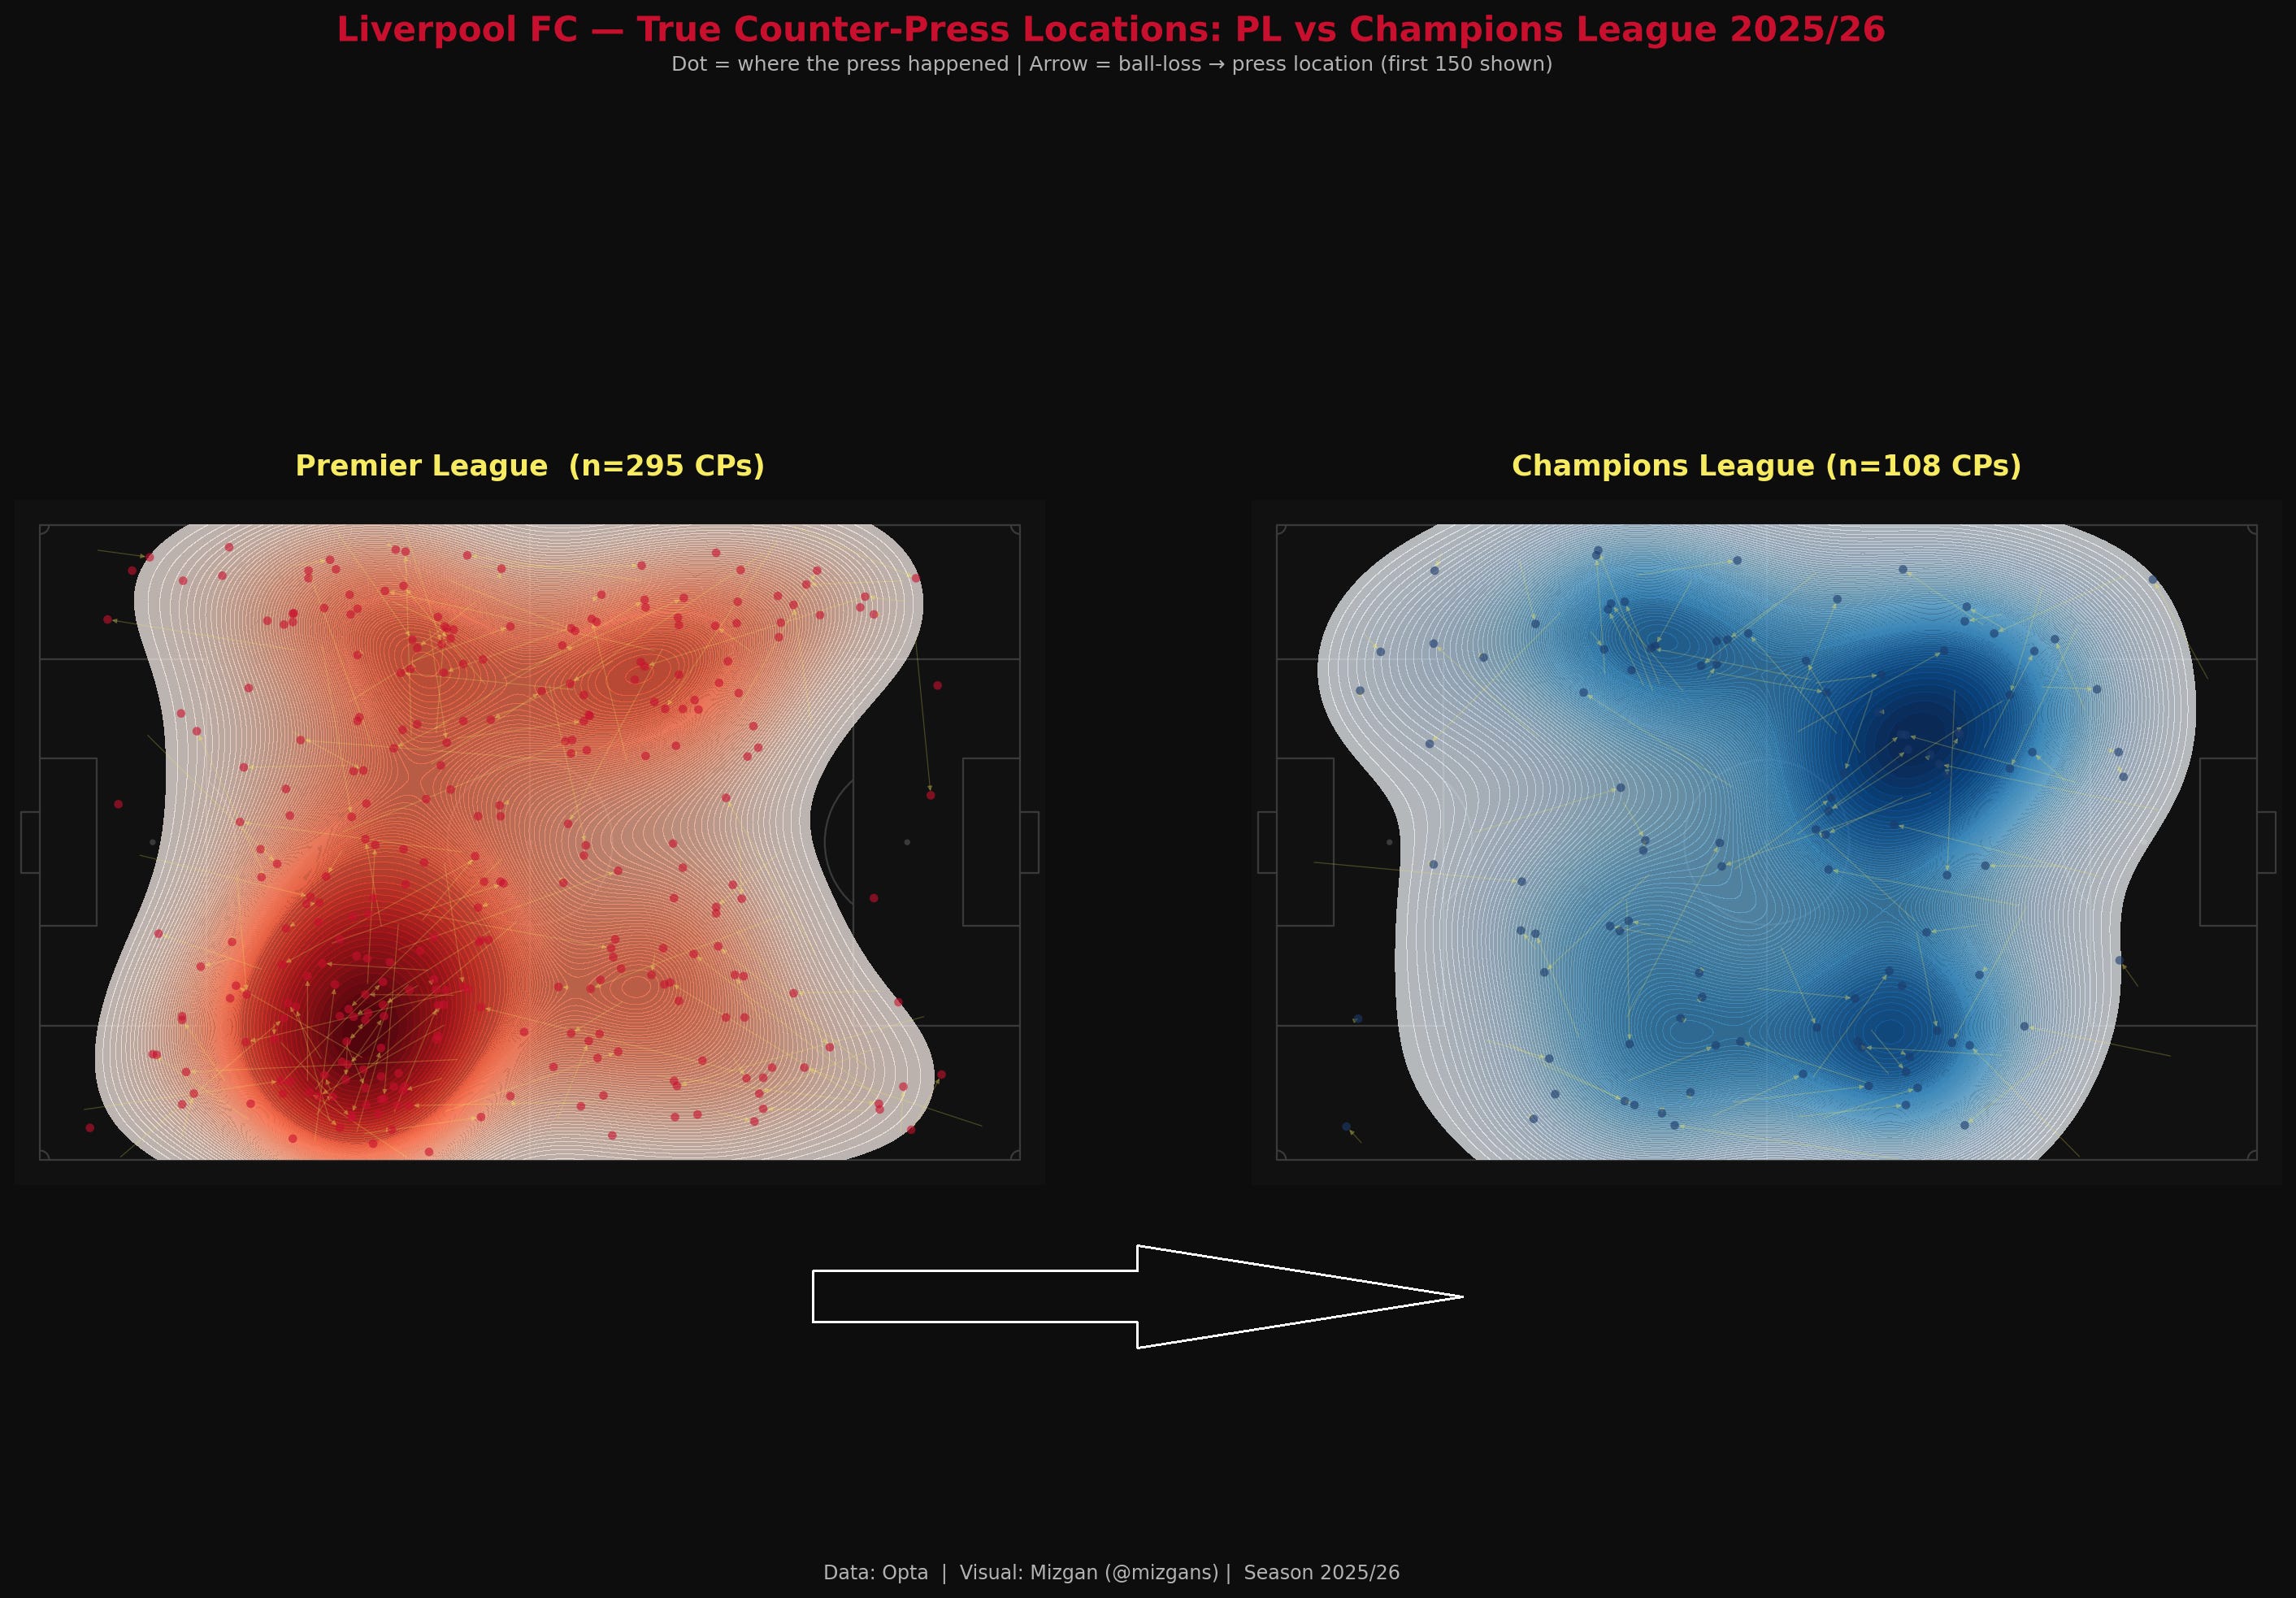
Liverpool are averaging 1.3 more counter-pressing actions per game in the Champions League compared to the Premier League. Similar to the duels heatmap, a large proportion of this counter-pressing takes place higher up the field in Europe, whereas in the league, it occurs much more in their own half.
Moreover, their counter-press success rate in the Premier League is 16.8% to the Champions League’s 26.3%. A significant difference!
The first visual shows Liverpool’s ball loss heatmap across the two competitions, followed by expected threat (xT) creation and the zones where they generate the most threat.
The rest of this article is for paid subscribers (only £3.50 to access six data-driven breakdowns, player and team analysis, scout reports per month; £4 off for an annual subscription).